https://dx.doi.org/10.24016/2026.v12.493
ORIGINAL ARTICLE
Preliminary Psychometric
Properties of the Gratitude Questionnaire in Peruvian College Students: A
Comparison of the GQ-6 and GQ-5
Andrei Franco-Jimenez 1*
1 Universidad Nacional
San Luis Gonzaga, Ica, Peru.
*
Correspondence: andrei.franco@unica.edu.pe
Received: November 30, 2025 | Revised: January 22, 2026 | Accepted: February 11, 2026 | Published Online: February 14, 2026.
CITE IT AS:
Franco-Jimenez, A. (2026). Preliminary Psychometric
Properties of the Gratitude Questionnaire in Peruvian College Students: A
Comparison of the GQ-6 and GQ-5. Interacciones,
12, e493. https://doi.org/10.24016/2026.v12.493
ABSTRACT
Introduction: Gratitude is associated with psychological well-being and reduced
psychopathology; however, the widely used Gratitude Questionnaire-6 (GQ-6) has
shown inconsistent psychometric performance across cultures, particularly due
to Item 6. In Latin America, evidence suggests that the abbreviated GQ-5
performs better, but no validation study has been conducted in the Peruvian
context.
Objective: This study examined the psychometric properties of the Gratitude
Questionnaire-6 (GQ-6) and its revised version, the Gratitude Questionnaire-5
(GQ-5), in a sample of 444 Peruvian college students.
Method: Participants completed the Spanish version of the Gratitude
Questionnaire adapted by Quezada Berumen et al. (2023), along with additional
measures to assess convergent validity. We conducted Exploratory Graph Analysis
(EGA) and confirmatory factor analysis (CFA) to evaluate the dimensional
structure and model fit. We also assessed measurement invariance by sex and
internal consistency.
Results: The GQ-6 demonstrated poor fit indices; therefore, we removed Item 6,
and the remaining items constituted the GQ-5. The initial GQ-5 model still
required modifications; correlating the error terms between Items 4 and 5
yielded a good fit (χ²(4) = 8.762, CFI = 0.998, RMSEA = 0.052, TLI = 0.995,
SRMR = 0.018). The final GQ-5 model demonstrated acceptable internal
consistency (ω = 0.73) and measurement invariance across sex. It also showed
good convergent validity, correlating positively with self-efficacy (r = 0.31),
mindfulness (r = 0.34), and well-being (r = 0.20), and negatively with
depression (r = –0.26).
Conclusion: This adaptation underscores the importance of cultural adjustments and
supports the GQ-5 as a reliable tool for assessing gratitude among Peruvian
students in research and clinical contexts.
Keywords: gratitude, psychometrics,
students, factor analysis, surveys and questionnaires.
INTRODUCTION
Gratitude can be defined as the appreciation of what is valuable and
meaningful to oneself; it reflects a general state of thankfulness or
appreciation (Sansone & Sansone, 2010). Research has shown that gratitude
uniquely predicts psychological well-being beyond other personality traits, contributing
to dimensions such as environmental mastery, positive relationships, and
self-acceptance (Wood et al., 2009). Moreover, gratitude has been associated
with higher subjective well-being and reduced psychopathological symptoms
(Jans-Beken et al., 2018).
In recent decades, psychological research has increasingly focused on
gratitude in clinical contexts. The demonstrated effectiveness of gratitude
interventions in enhancing well-being (Kirca et al.,
2023), along with their accessibility and ease of implementation—ranging from
verbal or written expressions of gratitude to simple reflective practices—make
them valuable tools for promoting mental health (Diniz et al., 2023). Given
these implications, accurate measurement of gratitude is important for both
research and clinical practice, as it deepens our understanding of well-being
and informs targeted intervention strategies (Youssef-Morgan et al., 2022).
The Gratitude Questionnaire-6 (GQ-6), developed by McCullough et al.
(2002), is one of the most widely used instruments for measuring dispositional
gratitude, originally conceptualized as a unidimensional construct. It
comprises six items designed to capture the frequency and intensity of grateful
feelings. Subsequent research has evaluated the factorial structure of the GQ-6
using confirmatory factor analysis in diverse cultural contexts. While several
studies have replicated the proposed unidimensional structure, others have
reported poor global fit indices, thereby questioning the adequacy of the
original six-item model (Chen et al., 2009; Rey et al., 2018; Valdez et al.,
2017; Hudecek et al., 2020).
Consistent problems have been reported with Item 6, “Long amounts of
time can go by before I feel grateful to something or someone” (Hudecek et al.,
2020; Valdez et al., 2017; Rey et al., 2018; Chen et al., 2009). To address
these fit-related problems, researchers have removed this item, yielding a
modified version such as the GQ-5, which has shown improved psychometric
properties (Balgiu, 2020; Chen et al., 2009; Ling et
al., 2021).
The GQ-5 has demonstrated acceptable internal consistency across
different populations, with Cronbach’s alpha ranging from 0.70 to 0.80 (Balgiu, 2020; Chen et al., 2009; Ling et al., 2021). It has
also shown good convergent validity, correlating positively with life
satisfaction and positive affect, and negatively with depression (Balgiu, 2020; Hudecek et al., 2020; Langer et al., 2016).
These findings highlight the need to re-evaluate the factor structure of the
GQ-6 across different cultural settings and to consider adopting the GQ-5 when
appropriate.
Despite its extensive use, the GQ-5 and GQ-6 have not been
psychometrically evaluated in the Peruvian context. Given cultural variations
in the expression and experience of gratitude, validating these instruments in
Peruvian populations is important to ensure their appropriateness and accuracy.
Previous validations in Latin American countries, such as Chile (Langer et al.,
2016), Mexico (Quezada Berumen et al., 2023), and Ecuador (Lima-Castro et al.,
2019), provide a foundation but also highlight the need for country-specific
assessments due to cultural nuances.
Beyond cultural differences, it is also important to consider potential
gender variations in gratitude expression. Research indicates that women tend
to report higher levels of optimism and gratitude (Yue et al., 2017), whereas
men are less likely to experience and express gratitude (Kashdan et al., 2009).
Assessing measurement invariance across gender ensures that the instrument
provides valid and comparable results for both men and women, thereby
strengthening the robustness of the findings.
This study aims to evaluate the psychometric properties of the GQ-5 and
GQ-6 in a sample of Peruvian university students. Assessing these measures in
this context has important implications for both research and practice. A
reliable and valid gratitude scale enables researchers and practitioners to
develop targeted interventions to enhance well-being. Moreover, validating this
instrument facilitates cross-cultural comparisons and strengthens its
applicability across diverse populations. These adaptations highlight the need
to ensure that psychological assessments are culturally relevant to maintain
their accuracy and reliability (Chen et al., 2009; Hudecek et al., 2020; Ling
et al., 2021).
METHODS
Design
The study follows an instrumental design to analyze the psychometric
properties of a self-report instrument (Ato et al., 2013).
Participants
The sample consisted of 444 students from two private universities and
one public university in the city of Ica. The questionnaires were completed
virtually via Google Forms. The sample comprised 277 women (62.4%) and 167 men
(37.6%), with ages ranging from 18 to 48 years (M = 20.37; SD = 3.30).
Exclusion criteria included being at least 18 years old and completing all
requested data. A non-probabilistic convenience sampling method was used, as
individuals were selected based on the researcher's accessibility and study
requirements (Kerlinger & Lee, 2002), consistent with the study's
preliminary and exploratory nature.
Measures
Gratitude Questionnaire-6 (GQ-6): The GQ-6,
developed by McCullough et al. (2002), is a self-report six-item scale that
assesses individual differences in the tendency to experience gratitude in
daily life. In the present study, we used the Spanish version adapted by
Quezada Berumen et al. (2023). Responses range from 1 to 7 on a 7-point
Likert-type scale (1 = strongly disagree; 7 = strongly agree). Example items
include "I have so much in life to be thankful for" and "If I
had to list everything that I felt grateful for, it would be a very long
list." In Latin American contexts, internal consistency of the GQ-6, as
measured by Cronbach's alpha, has been reported as 0.75 in Chile (Langer et
al., 2016), 0.84 in Ecuador (Lima-Castro et al., 2019), and 0.79 in Mexico
(Quezada Berumen et al., 2023).
It is important to note that Item 6, "Long amounts of time can go
by before I feel grateful to something or someone," has been identified as
problematic in previous studies (Hudecek et al., 2020; Valdez et al., 2017; Rey
et al., 2018; Chen et al., 2009). Consequently, the GQ-5 is a modified version
of the GQ-6 that excludes this item. In Chile, this five-item version
demonstrated a Cronbach's alpha of 0.72, while in Ecuador it showed a
reliability coefficient of 0.93 among adolescents and adults.
Patient Health Questionnaire-9 (PHQ-9): In this study,
we used the PHQ-9 as a self-administered scale to assess depressive symptoms.
The scale consists of nine items addressing depressive symptomatology
experienced during the two weeks prior to administration. Items are rated on a
Likert scale ranging from 0 (not at all) to 3 (nearly every day). Example items
include "Little interest or pleasure in doing things" and
"Feeling down, depressed, or hopeless." The PHQ-9 has demonstrated
adequate reliability in Peruvian samples, with a reported Cronbach's alpha of
0.87 (Villarreal-Zegarra et al., 2019). In the current study, Cronbach's alpha
was 0.85.
General Self-Efficacy Scale (GSES): The GSES was
used to assess beliefs about personal competence in effectively responding to
various stressful situations (Baessler & Schwarzer, 1996). The GSES
consists of 10 items with a unidimensional structure and response options
ranging from 1 (incorrect) to 4 (exactly true). Example items include "I
can always manage to solve difficult problems if I try hard enough" and
"I am confident that I could deal efficiently with unexpected
events." The GSES has shown good internal consistency, with a Cronbach's
alpha of 0.81 in a Peruvian sample (Grimaldo et al., 2021). In the present
study, Cronbach's alpha was 0.91, indicating excellent reliability.
Mindful Attention Awareness Scale (MAAS-5): We used the
five-item brief version of the MAAS-5, as suggested in previous studies (Osman
et al., 2016; van Dam et al., 2010). The MAAS-5 assesses attention to
present-moment experiences through five items rated on a scale from 1 (almost
always) to 6 (almost never). Higher scores indicate greater mindfulness. We
used the Spanish translation by Caycho-Rodríguez et al. (2019a). The MAAS-5 is
suitable for assessing mindfulness in populations without prior meditation
experience. In a Peruvian college sample, the scale demonstrated good
reliability, with an omega coefficient of 0.83 (Caycho-Rodríguez et al.,
2019b). In the present study, Cronbach's alpha was 0.87, indicating strong
reliability.
World Health Organization-Five Well-Being Index (WHO-5 WBI): We used the
Spanish version of the WHO-5 WBI, developed by Simancas-Pallares et al. (2016),
as a brief screening measure of well-being. It consists of five items (e.g.,
"I have felt cheerful and in good spirits") with four Likert-type
response options (0 = never, 1 = sometimes, 2 = often, 3 = always). The total
score is obtained by summing item scores, with 0 indicating the absence of
well-being and 15 indicating high well-being. This scale has demonstrated
adequate psychometric properties in a Peruvian sample, with good internal
consistency (α = 0.85) (Caycho-Rodríguez et al., 2020). In the present study,
Cronbach's alpha was also 0.85.
Procedures
The instruments were administered virtually using Google Forms.
Participants were students from one public university and two private
universities in Ica, Peru, recruited through social media platforms. Informed
consent was obtained online, with participants informed that participation was
voluntary and anonymous. It was also specified that the data would be used
exclusively for academic purposes. Completion of the questionnaire required
approximately 10 to 15 minutes.
Data Analysis
The psychometric evaluation was conducted using R software version 4.1.2
(R Core Team, 2021) and the lavaan package (Rosseel
et al., 2012). Given the ordinal nature of the data, we used polychoric correlations to estimate relationships among
items, yielding more accurate factor loadings in factor analysis (Pendergast et
al., 2017).
We conducted confirmatory factor analysis (CFA) to assess the fit of the
hypothesized factor structure using the weighted least squares mean and
variance adjusted (WLSMV) estimator. We evaluated model fit using RMSEA, SRMR,
CFI, and TLI. Acceptable fit was defined as RMSEA ≤ 0.07, CFI and TLI ≥ 0.95,
and SRMR ≤ 0.08 (Hair et al., 2010). We also reported the χ² statistic but did
not emphasize it due to its sensitivity to sample size.
In parallel, we implemented Exploratory Graph Analysis (EGA) using the EGAnet package (Golino & Christensen, 2021) to assess
dimensionality from a network psychometrics perspective. We estimated EGA using
the Gaussian Graphical LASSO (GLASSO) method with EBIC model selection (γ =
0.5) (Christensen & Golino, 2021) based on a polychoric
correlation matrix. The optimal penalty parameter (λ) was selected from a grid
of 100 values (ratio = 0.1). We conducted community detection using the Louvain
algorithm (Blondel et al., 2008) and assessed unidimensionality
by examining the number of detected communities. Additionally, we used the
Total Entropy Fit Index (TEFI) to evaluate global model fit.
We calculated reliability using the omega coefficient (McDonald, 1999)
as an alternative to Cronbach's alpha, addressing its limitations such as the
assumption of tau-equivalence (Cho, 2016; Sijtsma,
2009).
To examine measurement invariance, we followed the procedures
recommended by Wu and Estabrook (2016) and Svetina et al. (2020). We compared
configural invariance and threshold invariance across gender groups using the
WLSMV estimator. We evaluated invariance based on changes in CFI < 0.010 and
SRMR < 0.005 (Chen, 2007).
We examined convergent validity using Pearson correlations between the
GQ scores and the PHQ-9, GSES, MAAS-5, and WHO-5 WBI. Additionally, to assess
the relationship between the GQ-6 and its shortened version (GQ-5), we applied
a corrected Pearson correlation to account for spurious variance due to shared
items (Levy, 1967).
Ethical Aspects
This study adhered to the ethical principles outlined by the American
Psychological Association (2017). Before completing the survey, participants
received an informed consent form stating that participation was voluntary,
responses were anonymous, and data would be used exclusively for academic
purposes. The protocol was approved by the Institutional Ethics Committee of
the Universidad Nacional San Luis Gonzaga (CEI-UNICA No017). All participants
were informed of the study and signed a consent form prior to participation.
RESULTS
We performed a polychoric correlation analysis
on the instrument's items, as presented in Table 1. The results indicate that
the correlations of Item 3, "When I look at the world, I do not see much
to be grateful for," and Item 6, "Long amounts of time can go by before
I feel grateful to something or someone," with the remaining items were
all below .40. This suggests weak correlations between these items and the rest
of the instrument.
Table 1. Descriptive
statistics of the GQ-6 items
|
Items |
Polychoric
correlations of the items |
M |
SD |
g1 |
g2 |
ri-t |
ω if item
deleted |
|||||
|
|
1 |
2 |
3 |
4 |
5 |
6 |
|
|
|
|
|
|
|
1 |
- |
5.61 |
1.63 |
-1.45 |
1.52 |
0.56 |
0.55 |
|||||
|
2 |
0.75 |
- |
5.28 |
1.52 |
-0.95 |
0.55 |
0.62 |
0.55 |
||||
|
3 |
0.16 |
0.16 |
- |
4.73 |
1.70 |
-0.45 |
-0.82 |
0.18 |
0.75 |
|||
|
4 |
0.56 |
0.58 |
0.08 |
- |
5.16 |
1.51 |
-0.91 |
0.49 |
0.49 |
0.61 |
||
|
5 |
0.61 |
0.56 |
0.17 |
0.61 |
- |
5.52 |
1.49 |
-1.24 |
1.23 |
0.52 |
0.61 |
|
|
6 |
-0.08 |
0.01 |
0.34 |
-0.07 |
-0.13 |
- |
3.90 |
1.59 |
0.13 |
-0.80 |
0.10 |
0.76 |
Note. M =
mean; SD = standard deviation; g1 = skewness; g2 = kurtosis; ri–t = corrected item–total correlation; ω = McDonald’s
omega.
We conducted an Exploratory Graph Analysis (EGA) on both the six-item
(GQ-6) and five-item (GQ-5) versions. Figure 1a displays the network structure
of the GQ-6, whereas Figure 1b illustrates the GQ-5 version, which excludes
Item 6. The GQ-5 yielded a clear, unidimensional network: all five items formed
a single Louvain community, with a high edge density (0.900) and a TEFI of 0,
indicating no competing community solutions. In contrast, the GQ-6 produced a
two-community partition, a lower edge density (0.733), greater variability in
edge weights (Min = –0.062), and a negative TEFI (–3.102). These results
indicate reduced cohesion and suboptimal global fit. Together, these findings
suggest that Item 6 introduces noise or structural inconsistency, thereby challenging
the theoretical unidimensionality of the whole
questionnaire.
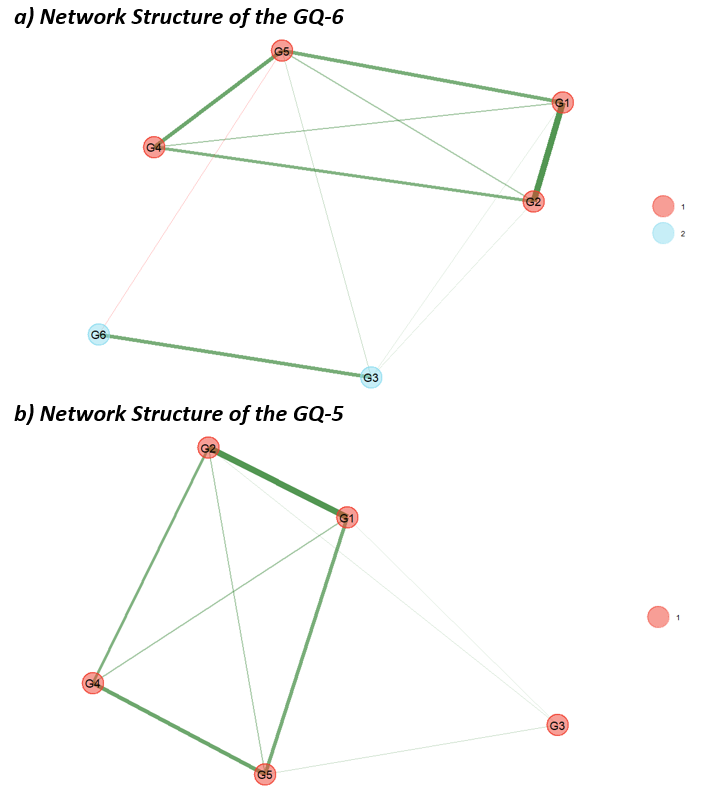
Figure
1. Exploratory Graph Analysis of the Gratitude
Questionnaire: Comparison between GQ-6 and GQ-5 Structures.
Table 2 presents the results of the CFA. The original unidimensional
GQ-6 model exhibited poor fit indices. These indices improved after removing
Item 6, as suggested in previous literature, resulting in the revised GQ-5
model. However, the RMSEA remained high. Therefore, we correlated the error
terms of Item 4, "I am grateful to a wide variety of people," and
Item 5, "As I get older, I find myself more able to appreciate the people,
events, and situations that have been part of my life history" (MI = 14.96).
We freely estimated this parameter in the final model.
Table 2. Fit Indices
of Three One-Factor Models for the GQ-5 and GQ-6
|
Models |
χ² |
df |
CFI |
TLI |
RMSEA |
SRMR |
|
GQ-6 |
196.11 |
9 |
0.918 |
0.864 |
0.217 |
0.086 |
|
GQ-5 |
39.84 |
5 |
0.984 |
0.969 |
0.125 |
0.035 |
|
GQ-5 model
with correlated errors terms between Items 4 and 5 |
8.76 |
4 |
0.998 |
0.995 |
0.052 |
0.018 |
Figures 2a–2c present the tested models. Figure 2a illustrates the
original GQ-6 model, Figure 2b depicts the GQ-5 model after removing Item 6,
and Figure 2c shows the final GQ-5 model, which includes correlated error terms
between Items 4 and 5. Across all models, Item 3 consistently exhibited low
factor loadings. Internal consistency analysis using the omega coefficient
indicated weak reliability for the GQ-6 (ω = .69), acceptable reliability for
the GQ-5 (ω = .76), and slightly lower reliability for the final model with
correlated error terms (ω = .73).
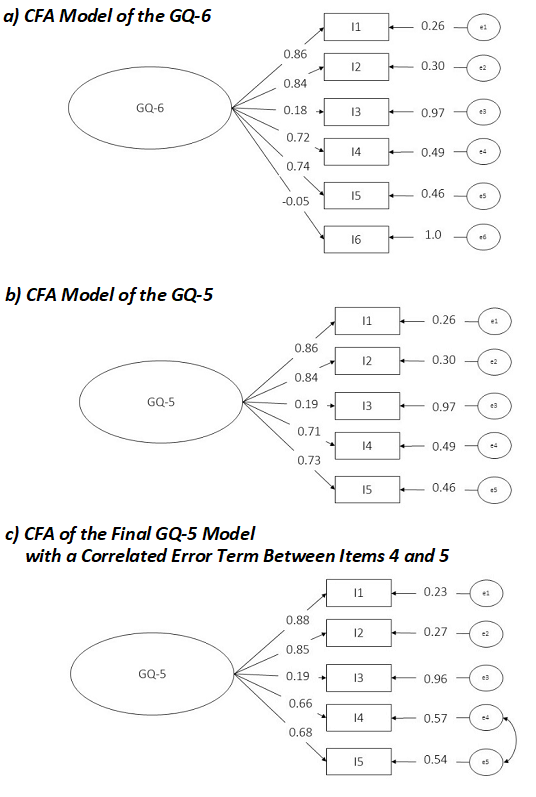
Figure
2. Comparison of Confirmatory Factor Analysis Models for
the Gratitude Questionnaire.
We conducted a measurement invariance analysis of the final GQ-5 model,
including correlated error terms, across two groups defined by sex, as
presented in Table 3. Configural invariance was supported based on the fit
indices. We then tested more restrictive levels of invariance, specifically
equal thresholds and equal loadings and thresholds across sex. These analyses
met the acceptable criteria for changes in CFI and SRMR (Chen, 2007).
Table 3. Measurement
Invariance of the Final GQ-5 Model Across Sex.
|
Model invariance |
χ2(df) |
CFI |
TLI |
SRMR |
ΔCFI |
ΔSRMR |
|
Configural |
26.254(8) |
0.992 |
0.981 |
0.030 |
- |
- |
|
Equal
thresholds |
45.205(28) |
0.993 |
0.995 |
0.030 |
0.001 |
0.000 |
|
Equal loadings
and thresholds |
38.745(32) |
0.997 |
0.998 |
0.030 |
0.004 |
0.000 |
Finally, we assessed convergent validity by examining the correlations
of the GQ-5 and GQ-6 with other psychological measures, as presented in Table
4. These measures included the PHQ-9 for depression, the GSES for
self-efficacy, the MAAS-5 for mindfulness, and the WHO-5 WBI for subjective
well-being. The GQ-5 showed significant correlations with these measures,
closely aligning with those of the GQ-6. A corrected Pearson correlation (Levy,
1967) indicated a strong association (r = .70) between the GQ-5 and GQ-6. Despite
the GQ-6's previously poor fit indices, we included it in this analysis for
comparison purposes.
Table 4. Correlations
of the GQ-5 and GQ-6 with Other Psychological Measures
|
Scale |
GQ-5 |
GQ-6 |
|
PHQ-9 |
-0.26 |
-0.27 |
|
GSES |
0.31 |
0.30 |
|
MAAS-5 |
0.34 |
0.35 |
|
WHO-5 WBI |
0.20 |
0.21 |
DISCUSSION
The present study aimed to evaluate the psychometric properties of the
GQ-5 and GQ-6 in a Peruvian sample, thereby contributing to the cross-cultural
validation of this widely used instrument. The findings indicate that the GQ-5,
derived from the GQ-6 by removing Item 6, demonstrates satisfactory
psychometric properties. Furthermore, correlating the error terms between Items
4 and 5 improved the model fit, supporting the utility of the GQ-5 for
assessing gratitude in the Peruvian context.
Consistent with previous studies across different cultures, Item 6,
"Long amounts of time can go by before I feel grateful to something or
someone," showed very low correlations with the other items, negatively
affecting the overall model fit. Removing Item 6 significantly improved the fit
indices, as reported by Hudecek et al. (2020), Valdez et al. (2017), and Balgiu (2020). This finding suggests that Item 6 may not
adequately capture the gratitude construct across cultural contexts, possibly
due to cultural nuances, differences in interpretation, or its reverse-scored
format. In addition, Chen et al. (2009) proposed that undergraduate students'
limited life experience may contribute to poor performance on Item 6. In
contrast, Langer et al. (2016) found that the five-item version was more
appropriate for younger populations.
In the final GQ-5 model, we correlated the error terms of Items 4 and 5.
We made this decision because both items explicitly refer to appreciation of
other people and share overlapping content, whereas the remaining items refer
to gratitude in more general terms. Notably, Fung (2024) also correlated these
error terms in his GQ-5 study, resulting in improved fit indices. Allowing this
residual correlation does not alter the unidimensional structure of the GQ-5 or
compromise the scale's construct validity.
The network analysis provides additional evidence of the GQ-6's
structural limitations. The EGA revealed a two-community solution for the
six-item version, with Item 6 clustering separately alongside Item 3. This
result is consistent with the CFA findings, which showed that Item 6 had poor
fit and was a candidate for removal. Notably, Item 6 was nearly disconnected
from the core gratitude cluster, and its strong association with Item 3 may
explain the low factor loading and residual correlations observed for Item 3 in
the CFA. In contrast, the reduced GQ-5 yielded a clear unidimensional
structure, with all five items forming a single cohesive community and showing
optimal global fit indices. Together, these findings support the exclusion of
Item 6 and reinforce the structural integrity of the five-item model.
Item 3, "When I look at the world, I do not see much to be grateful
for," exhibited a notably low factor loading in both the GQ-5 and GQ-6,
likely due to its reverse-scored format. Reverse-worded items often introduce
methodological challenges, such as increased cognitive load, which can lead to
misunderstanding or acquiescence bias (Suárez-Alvarez et al., 2018). Similar
issues with Item 3 have been reported in studies conducted in Chile (Langer et
al., 2016), Mexico (Quezada Berumen, 2023), Romania (Balgiu,
2020), Taiwan (Chen et al., 2009), and among Chinese and American adolescents
(Ling et al., 2021), where Item 3 consistently showed low factor loadings. This
low loading indicates that Item 3 did not contribute substantially to the
underlying gratitude construct in these samples. The consistency of this
pattern across cultures highlights the potential limitations of reverse-scored
items in the GQ-6. Future revisions of the questionnaire could consider
rephrasing or removing reverse-scored items to improve clarity and factorial
validity.
The analyses indicate that the GQ-5 demonstrates measurement invariance
between male and female participants. This finding is consistent with Balgiu (2020) and Rey et al. (2018), who also reported
measurement invariance across sex. Establishing measurement invariance allows
meaningful comparisons of gratitude levels between sexes in the Peruvian
context. It supports the use of the GQ-5 in both male and female samples in
cross-cultural research.
The internal consistency of the GQ-5, as indicated by McDonald's omega,
was acceptable and higher than that of the GQ-6. This result aligns with
previous studies reporting strong internal consistency for the GQ-5 (Balgiu, 2020; Ling et al., 2021; Chen et al., 2009; Fung,
2024), further supporting its reliability in assessing gratitude. These
findings suggest that, despite its small number of items, the GQ-5 provides a
reliable measure of gratitude across diverse populations.
The GQ-5 also demonstrated good convergent validity, as indicated by a
correlation of .34 with mindfulness. This association is consistent with
previous findings (Azad Marzabadi, Mills, & Valikhani,
2021; Swickert et al., 2019) and supports the
established relationship between these constructs. Mindful individuals are
generally more aware of and engaged in their present experiences, which
facilitates the recognition and appreciation of positive aspects of life and,
in turn, promotes gratitude. Similarly, individuals with higher levels of
gratitude may experience lower stress and fewer negative emotions, thereby
fostering a more mindful perspective (Azad Marzabadi
et al., 2021). In addition, we found a correlation of .31 between gratitude and
self-efficacy, indicating a meaningful association between these constructs.
This result is consistent with theoretical expectations, as both constructs are
positively related to adaptive psychological functioning (Datu & Yuen,
2020; Cousin et al., 2020).
Furthermore, we observed a correlation of .20 between gratitude and
subjective well-being, consistent with that reported by Kong et al. (2021).
According to Alkozei et al. (2018), two mechanisms
may account for this association. First, the cognitive framework proposes that
gratitude enhances the positive interpretation and recall of experiences,
thereby reducing negative thought patterns and promoting a healthier cognitive
style. Second, the psychosocial framework suggests that gratitude strengthens
interpersonal relationships and social support, thereby enhancing emotional and
physical well-being.
Consistent with previous research, we found a negative correlation
between gratitude and depression, comparable to the results reported by Langer
et al. (2016) (r = –.35), Rey et al. (2018) (r = –.47), and Dixit and Sinha
(2021) (r = –.30). Gratitude may enable individuals to reinterpret negative
experiences more positively, thereby reducing depressive symptoms through
increased resilience and personal growth. Moreover, gratitude enhances positive
emotions such as joy and satisfaction, which may counteract the reduced
positive affect commonly observed in depression (Lambert et al., 2012).
The findings of this study indicate that the GQ-5 has strong
psychometric properties, supporting its use as a reliable measure of gratitude.
This result is particularly relevant given the growing body of research
demonstrating the effectiveness of gratitude interventions in improving
well-being and reducing symptoms of depression and anxiety (Diniz et al., 2023;
Kirca et al., 2023). A rigorously validated
instrument supports both clinical practice and research by enabling accurate
assessment of gratitude and its association with mental health outcomes.
Limitations
Despite its strengths, this study has several limitations. The sample
may not fully reflect the diversity of the Peruvian population, limiting the
generalizability of the findings. Future research should include larger, more
diverse samples and employ longitudinal designs to examine the stability of the
gratitude construct over time and across demographic groups.
Conclusion
Removing Item 6 from the GQ-6 improved the scale's factor structure and
reliability, yielding the GQ-5, a version supported by the literature and
demonstrating satisfactory psychometric properties in a Peruvian context. In
addition, establishing measurement invariance across sex enables meaningful
comparisons between male and female participants. The scale also shows
appropriate correlations with related psychological constructs, supporting its
use in research and clinical practice. Overall, the GQ-5 represents a reliable
instrument for assessing gratitude among Peruvian students in both research and
clinical settings.
ORCID
Andrei Franco-Jimenez: https://orcid.org/0000-0001-8648-834X
AUTHORS’ CONTRIBUTION
Andrei Franco-Jimenez:
Conceptualization, Methodology, Formal analysis, Investigation, Data Curation,
Writing - Original Draft, Writing - Review & Editing, Visualization.
FUNDING SOURCE
This study was self-funded
by the author. No external financial support or institutional funding was
received.
CONFLICT OF INTEREST
The author declares no conflicts of interest.
ACKNOWLEDGMENTS
Not applicable.
REVIEW PROCESS
This study has been reviewed by two external reviewers in double-blind
mode. The editor in charge was David Villarreal-Zegarra. The review process is
included as supplementary material 1.
DATA AVAILABILITY STATEMENT
The author declares that the
data supporting this study are available from the author upon reasonable
request.
DECLARATION OF THE USE OF GENERATIVE ARTIFICIAL
INTELLIGENCE
ChatGPT was used exclusively for minor
language polishing and wording refinement.
The final version of the manuscript was entirely
reviewed and approved by the
author.
DISCLAIMER
The authors are responsible for all statements made in this article.
REFERENCES
Alkozei,
A., Smith, R., & Killgore, W. D. S. (2018). Gratitude and subjective
wellbeing: A proposal of two causal frameworks. Journal of Happiness
Studies, 19(5), 1519–1542. https://doi.org/10.1007/s10902-017-9870-1
American
Psychological Association. (2017). Ethical principles of psychologists and
code of conduct (2002, amended effective June 1, 2010, and January 1,
2017). https://www.apa.org/ethics/code/
Ato,
M., López-García, J. J., & Benavente, A. (2013). Un sistema de
clasificación de los diseños de investigación en psicología. Anales de
Psicología, 29(3), 1038–1059. https://doi.org/10.6018/analesps.29.3.178511
Azad
Marzabadi, E., Mills, P. J., & Valikhani, A.
(2021). Positive personality: Relationships
among mindful and grateful personality traits with quality of life and health
outcomes. Current Psychology, 40(3), 1448–1465. https://doi.org/10.1007/s12144-018-0080-8
Baessler,
J., & Schwarzer, R. (1996). Evaluación
de la autoeficacia: Adaptación española de la Escala de Autoeficacia General [Measuring generalized self-beliefs: Spanish adaptation of the General Self-Efficacy Scale]. Ansiedad
y Estrés, 2(1), 1–8.
Balgiu,
B. A. (2020). The reliability and the construct validity of the Gratitude
Questionnaire (GQ-6) in a sample of Romanian undergraduates. Journal of
Educational Sciences and Psychology, 10(1), 101–109.
Blondel,
V. D., Guillaume, J.-L., Lambiotte, R., & Lefebvre, E. (2008). Fast
unfolding of communities in large networks. Journal of Statistical
Mechanics: Theory and Experiment, 2008(10), P10008. https://doi.org/10.1088/1742-5468/2008/10/P10008
Caycho-Rodríguez,
T., García Cadena, C. H., Reyes-Bossio, M., Cabrera-Orosco, I., Oblitas
Guadalupe, L. A., & Arias Gallego, W. L. (2019b). Evidencias
psicométricas de una versión breve de la Mindful Awareness Attention Scale en estudiantes universitarios [Psychometric evidence of a brief version of
the Mindful Awareness Attention Scale in college students]. Revista Argentina de Ciencias del Comportamiento, 11(3), 19–32. https://doi.org/10.32348/1852.4206.v11.n3.24870
Caycho-Rodríguez,
T., Ventura-León, J., Azabache-Alvarado, K., Reyes-Bossio, M., &
Cabrera-Orosco, I. (2020). Validez e invariancia factorial del Índice de
Bienestar General (WHO-5 WBI) en universitarios peruanos. Revista Ciencias
de la Salud, 18(3), 1–23. https://doi.org/10.12804/revistas.urosario.edu.co/revsalud/a.9797
Caycho-Rodríguez,
T., Ventura-León, J., Martínez-Munive, R., & Barboza-Palomino, M. (2019a).
Traducción y validez de contenido de una escala breve de mindfulness para
adolescentes peruanos. Enfermería Clínica, 29(5), 308–312.
https://doi.org/10.1016/j.enfcli.2018.10.002
Chen,
F. F. (2007). Sensitivity of goodness of fit
indexes to lack of measurement invariance. Structural Equation Modeling: A
Multidisciplinary Journal, 14(3), 464–504. https://doi.org/10.1080/10705510701301834
Chen,
L. H., Chen, M.-Y., Kee, Y. H., & Tsai, Y.-M. (2009). Validation of the
Gratitude Questionnaire (GQ) in Taiwanese undergraduate students. Journal of
Happiness Studies, 10(6), 655–664. https://doi.org/10.1007/s10902-008-9112-7
Christensen,
A. P., & Golino, H. (2021). On the equivalency of factor and network
loadings. Behavior Research Methods, 53(4), 1563–1580. https://doi.org/10.3758/s13428-020-01500-6
Cho,
E. (2016). Making reliability reliable. Organizational Research Methods, 19(4),
651–682. https://doi.org/10.1177/1094428116656239
Cousin,
L., Buck, H., Benitez, B., Mills, P., & Redwine, L. (2020). A structural
equation model of gratitude, self-efficacy, and medication adherence in
patients with stage B heart failure. Journal of Cardiovascular Nursing, 35(6),
E18–E24. https://doi.org/10.1097/JCN.0000000000000721
Datu,
J., & Yuen, M. (2020). Students’ connectedness is linked to higher
gratitude and self-efficacy outcomes. Children and Youth Services Review,
116, 105210. https://doi.org/10.1016/j.childyouth.2020.105210
Diniz,
G., Korkes, L., Tristão, L. S., Pelegrini, R., Bellodi,
P. L., & Bernardo, W. M. (2023). The effects
of gratitude interventions: A systematic review and meta-analysis. Einstein,
21, eRW0371. https://doi.org/10.31744/einstein_journal/2023RW0371
Dixit,
S. K., & Sinha, J. (2021). Adaptation and validation of the Gratitude
Questionnaire (GQ-6) for the Indian context. Current Psychology. Advance
online publication. https://doi.org/10.1007/s12144-021-02143-2
Fung,
S.-F. (2024). Evaluating the psychometric properties of the Gratitude
Questionnaire in a Chinese sample: Comparing the 6-item and 5-item versions. Mindfulness,
15(9), 2321–2329. https://doi.org/10.1007/s12671-024-02433-3
Golino,
H., & Christensen, A. P. (2021). EGAnet:
Exploratory Graph Analysis – A framework for estimating the number of
dimensions in multivariate data using network psychometrics (R package
version 1.2.4). https://CRAN.R-project.org/package=EGAnet
Grimaldo,
M., Correa, J., & Calderón-De la Cruz, G. (2021). Evidencias psicométricas
de la Escala de Autoeficacia General (EAG) en universitarios peruanos. Ansiedad
y Estrés, 27, 132–139. https://doi.org/10.5093/anyes2021a18
Hair,
J. F., Black, W. C., Babin, B. J., & Anderson, R. E. (2010). Multivariate
data analysis (7th ed.). Pearson.
Hudecek,
M. F. C., Blabst, N., Morgan, B., & Lermer, E. (2020). Measuring gratitude in Germany:
Validation study of the German version of the Gratitude Questionnaire–Six Item
Form (GQ-6-G) and the Multi-Component Gratitude Measure (MCGM-G). Frontiers
in Psychology, 11, 590108. https://doi.org/10.3389/fpsyg.2020.590108
Jans-Beken,
L., Lataster, J., Peels, D., Lechner, L., &
Jacobs, N. (2018). Gratitude, psychopathology and subjective well-being:
Results from a 7.5-month prospective general population study. Journal of
Happiness Studies, 19(6), 1673–1689. https://doi.org/10.1007/s10902-017-9893-7
Kashdan,
T. B., Mishra, A., Breen, W. E., & Froh, J. J. (2009). Gender differences
in gratitude: Examining appraisals, narratives, the willingness to express
emotions, and changes in psychological needs. Journal of Personality, 77(3),
691–730. https://doi.org/10.1111/j.1467-6494.2009.00562.x
Kerlinger,
F. N., & Lee, H. B. (2002). Investigación
del comportamiento: Métodos de investigación en ciencias sociales. McGraw-Hill Interamericana.
Kirca,
A., Malouff, J. M., & Meynadier, J. (2023). The effect of expressed
gratitude interventions on psychological well-being: A meta-analysis of randomised controlled studies. International Journal of
Applied Positive Psychology, 8, 63–86. https://doi.org/10.1007/s41042-023-00086-6
Kong,
F., Yang, K., Yan, W., & Li, X. (2021). How does
trait gratitude relate to subjective well-being in Chinese adolescents? The
mediating role of resilience and social support. Journal of Happiness
Studies, 22(4), 1611–1622. https://doi.org/10.1007/s10902-020-00286-w
Lambert,
N. M., Fincham, F. D., & Stillman, T. F. (2012). Gratitude and depressive
symptoms: The role of positive reframing and positive emotion. Cognition & Emotion, 26(4),
615–633. https://doi.org/10.1080/02699931.2011.595393
Langer,
Á., Ulloa, V., Aguilar-Parra, J. M., Araya-Veliz, C., & Brito, G. (2016). Validation
of a Spanish translation of the Gratitude Questionnaire (GQ-6) with a Chilean
sample of adults and high schoolers. Health and Quality of Life Outcomes, 14,
1–9. https://doi.org/10.1186/s12955-016-0450-6
Levy,
P. (1967). The correction for spurious correlation in the evaluation of
short-form tests. Journal of Clinical Psychology, 23(1), 84–86.
https://doi.org/10.1002/1097-4679(196701)23:1%3C84::AID-JCLP2270230123%3E3.0.CO;2-2
Lima-Castro,
S., Peña-Contreras, E., Aguilar-Sizer, M., Bueno-Pacheco, A., &
Arias-Medina, P. (2019). Adaptación y validación del Cuestionario de Gratitud
GQ-6 para el contexto ecuatoriano. Avaliação
Psicológica, 18(2), 129–137. https://doi.org/10.15689/ap.2019.1802.15689.03
Ling,
Y., Yang, Q., Zeng, Y., & Huebner, E. S. (2021). Assessing
the measurement invariance of the Gratitude Questionnaire–5 in Chinese and
American adolescents. The Spanish Journal of Psychology, 24, Article
e17. https://doi.org/10.1017/SJP.2021.19
McCullough,
M. E., Emmons, R. A., & Tsang, J.-A. (2002). The grateful disposition: A
conceptual and empirical topography. Journal of Personality and Social
Psychology, 82(1), 112–127. https://doi.org/10.1037/0022-3514.82.1.112
McDonald, R. P. (1999). Test theory: A unified treatment.
Lawrence Erlbaum Associates Publishers.
Osman,
A., Lamis, D. A., Bagge, C. L., Freedenthal, S.,
& Barnes, S. M. (2016). The mindful attention awareness scale: Further
examination of dimensionality, reliability, and concurrent validity estimates. Journal
of Personality Assessment, 98(2), 189–199.
https://doi.org/10.1080/00223891.2015.1095761
Pendergast,
L. L., von der Embse, N., Kilgus, S. P., &
Eklund, K. R. (2017). Measurement equivalence: A non-technical primer on
categorical multi-group confirmatory factor analysis in school psychology. Journal
of School Psychology, 60, 65–82. https://doi.org/10.1016/j.jsp.2016.11.002
Quezada
Berumen, L. (2023). Estudio de validez y confiabilidad
del Cuestionario de Gratitud-6 (GQ-6) en México. Acta de Investigación
Psicológica, 13(1), 42–52. https://doi.org/10.22201/fpsi.20074719e.2023.1.476
R
Core Team. (2021). R: A language and
environment for statistical computing. R Foundation for Statistical
Computing. https://www.R-project.org/
Rey,
L., Sánchez-Álvarez, N., & Extremera, N. (2018). Spanish
Gratitude Questionnaire: Psychometric properties in adolescents and
relationships with negative and positive psychological outcomes. Personality
and Individual Differences, 135, 173–175. https://doi.org/10.1016/j.paid.2018.07.005
Rosseel,
Y. (2012). lavaan: An R package for structural
equation modeling. Journal of Statistical Software, 48, 1–36. https://doi.org/10.18637/JSS.V048.I02
Sansone,
R. A., & Sansone, L. A. (2010). Gratitude and well being:
The benefits of appreciation. Psychiatry (Edgmont),
7(11), 18–22.
Sijtsma,
K. (2009). On the use, the misuse, and the very limited usefulness of
Cronbach’s alpha. Psychometrika, 74(1), 107–120. https://doi.org/10.1007/s11336-008-9101-0
Simancas-Pallares,
M., Díaz-Cárdenas, S., Barbosa-Gómez, P., Buendía-Vergara, M., &
Arévalo-Tovar, L. (2016). Propiedades psicométricas del Índice de Bienestar
General-5 de la Organización Mundial de la Salud en pacientes parcialmente
edéntulos. Revista de la Facultad de Medicina, 64(4), 701–705. https://doi.org/10.15446/revfacmed.v64n4.52235
Suárez-Álvarez,
J., Pedrosa, I., Lozano, L. M., García-Cueto, E., Cuesta, M., & Muñiz, J.
(2018). Using reversed items in Likert
scales: A questionable practice. Psicothema,
30(2), 149–158. https://doi.org/10.7334/psicothema2018.33
Svetina, D., Rutkowski,
L., & Rutkowski, D. (2020). Multiple-group invariance with
categorical outcomes using updated guidelines: An illustration using Mplus and the lavaan/semTools packages. Structural Equation Modeling, 27(1),
111–130. https://doi.org/10.1080/10705511.2019.1602776
Swickert,
R., Bailey, E., Hittner, J., Spector, A., & Brittaney, B. (2019). The
mediational roles of gratitude and perceived support in explaining the
relationship between mindfulness and mood. Journal of Happiness Studies, 20(3),
815–828. https://doi.org/10.1007/s10902-017-9952-0
Valdez,
J. P., Yang, W., & Datu, J. A. (2017). Validation of the Gratitude
Questionnaire in Filipino secondary school students. The Spanish Journal of
Psychology, 20, e45. https://doi.org/10.1017/sjp.2017.51
Van
Dam, N. T., Earleywine, M., & Borders, A. (2010). Measuring mindfulness? An
item response theory analysis of the Mindful Attention Awareness Scale. Personality
and Individual Differences, 49(7), 805–810.
https://doi.org/10.1016/j.paid.2010.07.020
Villarreal-Zegarra,
D., Copez-Lonzoy, A., Bernabé-Ortiz, A.,
Melendez-Torres, G. J., & Bazo-Alvarez, J. C. (2019). Valid group
comparisons can be made with the Patient Health Questionnaire (PHQ-9): A
measurement invariance study across groups by demographic characteristics. PLOS
ONE, 14(9), e0221717. https://doi.org/10.1371/journal.pone.0221717
Wood,
A., Joseph, S., & Maltby, J. (2009). Gratitude predicts psychological
well-being above the Big Five facets. Personality and Individual
Differences, 46(4), 443–447. https://doi.org/10.1016/j.paid.2008.11.012
Wu,
H., & Estabrook, R. (2016). Identification of confirmatory factor analysis
models of different levels of invariance for ordered categorical outcomes. Psychometrika,
81(4), 1014–1045. https://doi.org/10.1007/s11336-016-9506-0
Youssef-Morgan,
C. M., van Zyl, L. E., & Ahrens, B. L. (2022). The Work Gratitude Scale:
Development and evaluation of a multidimensional measure. Frontiers in
Psychology, 12, 795328. https://doi.org/10.3389/fpsyg.2021.795328
Yue,
X. D., Hiranandani, N. A., Jiang, F., Hou, Z., & Chen, X. (2017). Unpacking
the gender differences on mental health: The effects of optimism and gratitude.
Psychological Reports, 120(4), 639–649. https://doi.org/10.1177/0033294117701136