https://dx.doi.org/10.24016/2026.v12.501
ORIGINAL ARTICLE
Psychometric Validation of the Flourishing Scale among LGBT Population
Juan Aníbal González-Rivera1 *
1 School of
Behavioral and Brain Sciences, Ponce Health Sciences University, Puerto Rico
* Correspondence: jagonzalez@psm.edu
Received: January 02, 2026 | Revised: February 17, 2026 | Accepted: March 03, 2026 | Published Online: March 08, 2026.
CITE IT AS:
González-Rivera, J. (2026). Psychometric Validation of
the Flourishing Scale among LGBT Population. Interacciones, 12, e501. https://doi.org/10.24016/2026.v12.501
ABSTRACT
Introduction: Flourishing is a key indicator of positive mental
health and psychosocial functioning. However, evidence on the measurement
performance of the Flourishing Scale (FS) in sexual and gender minority
(LGBT/SGM) populations in the Spanish-speaking Caribbean remains limited.
Objective: To evaluate the psychometric properties of the FS
among LGBT adults in Puerto Rico.
Method: Participants were recruited online (N = 300). Given
item-level and multivariate non-normality, a robust one-factor CFA was
estimated and examined global fit, standardized loadings, and reliability
(α, ω). Evidence for validity included (a) Average Variance Extracted
(AVE) as an indicator-level convergence index and (b) associations with
external criteria (PHQ-8, GAD-7). Multi-group CFA tested configural, metric,
and scalar invariance across gender identity and sexual orientation.
Results: The robust CFA supported a unidimensional structure
with strong standardized loadings and high internal consistency. AVE exceeded
.50, indicating adequate indicator-level convergence within the measurement
model. As hypothesized, FS scores correlated negatively with PHQ-8 and GAD-7.
Multi-group CFA supported metric and scalar invariance by gender identity and
scalar invariance by sexual orientation, with borderline evidence at the metric
step, enabling latent-mean comparisons under supported conditions.
Conclusions: The FS is a brief, reliable, and valid indicator of
psychological flourishing among LGBT adults in Puerto Rico, suitable for
research, screening, and program evaluation; however, convergent validity with
an independent positive well-being measure should be established in future
work.
Keywords: Flourishing, LGBT, Psychometric validation, Measurement invariance, Well-being.
INTRODUCTION
Flourishing has become a cornerstone of positive
psychology for understanding positive mental health and optimal human
functioning. Conceptually, flourishing refers to a broad indicator of
eudaimonic and psychosocial well-being that reflects perceived meaning and
purpose, supportive relationships, engagement, competence, and optimism. Unlike
approaches focused exclusively on psychopathology, flourishing underscores the
presence of resources—life purpose, positive relationships, sense of
competence, and personal growth—that sustain meaningful lives beyond the mere
absence of symptoms (Diener et al., 2010; Mansouri, 2025). Within this
framework, Diener and colleagues’ Flourishing Scale (FS), composed of eight
Likert-type items, provides a global index of psychosocial well-being with
advantages of brevity, ease of administration, and cross-cultural comparability
(De la Fuente et al., 2017). Operationally, the FS is typically modeled as a
single latent factor, with higher scores indicating greater perceived psychosocial
flourishing. Its widespread adoption has supported research into correlates of
well-being, evaluation of interventions, and population monitoring of health
assets across languages and contexts (Didino et al.,
2019; Landa-Blanco et al., 2023; Pozo-Muñoz et al., 2016).
The validity of use of any instrument requires that
its psychometric properties—structure, reliability, validity, and measurement
invariance—be supported in the specific populations and settings where it is
applied. This requirement is especially critical for sexual and gender minority
(LGBT/SGM) populations. A substantial body of evidence shows that exposure to
structural and everyday stigma, microaggressions, barriers in health services,
and limited access to affirmative supports is associated with a greater symptom
burden and lower subjective well-being, particularly among transgender and
non-binary people (Expósito-Campos et al., 2022).
Minority stress mechanisms include distal processes (e.g., victimization) and
proximal processes (e.g., internalized sexual stigma) that erode
self-acceptance and agency, undermining the capacity to thrive even in the
absence of a manifest clinical disorder (Kittiteerasack et al., 2021).
Assessing flourishing in these groups is therefore not ancillary: it provides a
complement to deficit-focused indicators, helps identify individual and
community resources (e.g., social support, belonging, purpose), and guides
affirmative interventions and public policies aimed at reducing disparities.
International research suggests that the FS typically
exhibits adequate internal consistency, convergent/discriminant validity, and,
frequently, a unidimensional structure across translations and diverse contexts
(De la Fuente et al., 2017; Didino et al., 2019;
Landa-Blanco et al., 2023; Pozo-Muñoz et al., 2016). In Spanish-speaking
samples, favorable fit indices and α and ω coefficients ≥ .80
have been reported, supporting its use as a global indicator of well-being
(Martín-Carbonell et al., 2021; Landa-Blanco et al., 2023). Studies conducted
in countries with varied languages and cultures have also advanced evidence of
invariance by sex and age (Martín-Carbonell et al., 2021; Espejo et al., 2022;
Mansouri, 2025; Sabah et al., 2025). However, extrapolating these findings to
LGBT/SGM populations without specific validation is methodologically risky
given the potential for measurement bias by gender identity, sexual
orientation, age, or language.
Validating the FS among LGBT/SGM populations is
warranted because demonstrating mean differences in flourishing between
LGBT/SGM and non-LGBT/SGM groups is conceptually distinct from demonstrating
that a self-report instrument functions equivalently across groups. Meaningful
group comparisons require evidence of measurement invariance; otherwise,
observed differences may reflect measurement non-equivalence (e.g., differences
in item intercepts/thresholds or item–factor relations) rather than true differences
in the latent construct (Meredith, 1993; Putnick & Bornstein, 2016;
Vandenberg & Lance, 2000). This concern is especially relevant for
subjective Likert-type ratings, which can be influenced by reference-group
effects—i.e., respondents may evaluate their standing relative to different
comparison standards across social contexts—thereby compromising comparability
even when a scale has performed well in other settings (Heine et al., 2002).
Minority stress and structural stigma provide
plausible pathways through which item interpretation and response processes
could vary across LGBT/SGM subgroups. Minority stress theory emphasizes that
stigma-related distal and proximal stressors (e.g., discrimination,
concealment, expectations of rejection, internalized stigma) shape
self-appraisals and well-being (Meyer, 2003). Structural stigma further
highlights how societal-level norms and policies constrain opportunities and
resources, influencing psychosocial functioning and health-relevant processes
(Hatzenbuehler, 2016; Hatzenbuehler et al., 2013). In this context, items
referencing “purpose,” “optimism,” or “positive relationships” may be anchored
to different lived constraints and comparison frames across gender identity and
sexual-orientation groups, making it essential to test the FS’s structure and
measurement invariance in LGBT/SGM adults in Puerto Rico before drawing
subgroup comparisons.
In Puerto Rico, the need for local evidence is
pressing. The Island shares legal and cultural frameworks with Latin America
and the United States, yet it presents distinct sociocultural dynamics (e.g.,
religiosity, health policies, exposure to disasters, and migratory mobility)
that may shape both the experience of well-being and psychometric responses to
the FS. To our knowledge, there are two formal validations of the FS in Puerto
Rico, both in non-clinical samples and not focused on LGBT/SGM populations: (a)
González-Rivera (2018), who reported a unidimensional structure and adequate
internal consistency in adults on the Island; and (b) González-Rivera (2019),
who validated the FS in the atheist community of Puerto Rico, confirming a
convergent pattern with indicators of well-being and robust reliability. While
these studies strengthen the local evidence base, a critical gap remains it is
unknown whether the FS functions equivalently among LGBT/SGM individuals
residing in Puerto Rico and whether it allows valid comparisons across
subgroups (e.g., cisgender gay men, cisgender lesbian women, bisexual people,
transgender and non-binary people).
Alongside this psychometric gap, there is a practical
need for Puerto Rico’s public health and affirmative services to have a brief,
psychometrically sound measure that can map well-being resources and evaluate
the impact of support initiatives in clinical, educational, and workplace
settings. To support construct validity evidence based on relations to other
variables, FS scores were examined in relation to depressive symptoms (PHQ-8)
and anxiety symptoms (GAD-7), which are highly prevalent among sexual and
gender minorities. Consistent with theory and prior findings, negative
associations of moderate to large magnitude were expected between flourishing
and depression/anxiety, a pattern aligned with evidence linking the FS to
higher positive affect and life satisfaction and, simultaneously, to lower
negative affect and internalizing symptoms across countries and languages (De
la Fuente et al., 2017; Didino et al., 2019;
Landa-Blanco et al., 2023). Importantly, these associations do not imply
conceptual redundancy: flourishing captures resources and optimal functioning
that may coexist with varying levels of distress, reinforcing its usefulness
for designing asset-focused affirmative interventions rather than approaches
solely aimed at symptom reduction.
General Objective
The overarching goal of this study is to
psychometrically evaluate the Flourishing Scale (FS) among LGBT/SGM adults
residing in Puerto Rico. Specifically, the study aims to: (1) confirm the FS’s
unidimensional factor structure via confirmatory factor analysis; (2) estimate
internal consistency reliability (α, ω) and indicator-level
convergence using Average Variance Extracted (AVE; Fornell & Larcker,
1981); (3) examine theoretically expected associations with depressive symptoms
(PHQ-8) and anxiety symptoms (GAD-7) as external validity evidence; and (4)
test configural, metric, and scalar measurement invariance across gender
identity and sexual orientation to support unbiased subgroup comparisons when
supported by the data (Meredith, 1993; Putnick & Bornstein, 2016;
Vandenberg & Lance, 2000).
METHODS
Research Design
A nonexperimental, cross-sectional, instrumental
design was used to conduct a psychometric evaluation of the FS in an LGBT
sample from Puerto Rico, following methodological guidance for measurement
studies (Ato et al., 2013).
Participants
A non-probability, convenience (self-selected) online
sampling approach was used. A total of 300 individuals who met the eligibility
criteria were included: (1) 21 years of age or older, (2) self-identified as
members of the LGBT community, and (3) resided in Puerto Rico. No missing data
were recorded for sociodemographic variables. The mean age was M = 37.69 years
(SD = 11.50), ranging from 21 to 59 years. For multi-group measurement
invariance testing, subgroup analyses were restricted to categories with sufficient
sample sizes to support stable model estimation and interpretable invariance
decisions (Meredith, 1993; Putnick & Bornstein, 2016; Vandenberg &
Lance, 2000). Accordingly, gender-group invariance focused on the two largest
gender-identity categories (masculine and feminine), and sexual-orientation
invariance was evaluated among gay, lesbian, and bisexual participants; smaller
categories (e.g., nonbinary and transgender; pansexual and “other”) were
retained in descriptive reporting but were not modeled in multi-group CFA due
to limited cell sizes (see Table 1).
Table 1. Socio-demographic
Characteristics of the Sample (n = 300).
|
Variable |
Category |
n |
% |
|
Gender identity |
Masculine |
165 |
55.0 |
|
Feminine |
113 |
37.7 |
|
|
Nonbinary |
11 |
3.7 |
|
|
Transgender |
7 |
2.3 |
|
|
|
Other |
4 |
1.3 |
|
Sex |
Man |
170 |
56.7 |
|
Woman |
126 |
42.0 |
|
|
Intersex |
2 |
0.7 |
|
|
|
Other |
2 |
0.7 |
|
Sexual orientation |
Gay |
148 |
49.3 |
|
Lesbian |
73 |
24.3 |
|
|
Bisexual |
49 |
16.3 |
|
|
Pansexual |
19 |
6.3 |
|
|
|
Other |
11 |
3.7 |
|
Marital status |
Single |
126 |
42.0 |
|
Partnered, cohabiting |
87 |
29.0 |
|
|
Partnered, not cohabiting |
37 |
12.3 |
|
|
Married |
36 |
12.0 |
|
|
Divorced |
8 |
2.7 |
|
|
Separated |
3 |
1.0 |
|
|
|
Widowed |
3 |
1.0 |
|
Approx. annual household income |
$0–20,999 |
112 |
37.3 |
|
$21,000–30,999 |
65 |
21.7 |
|
|
$31,000–40,999 |
51 |
17.0 |
|
|
$41,000–50,999 |
19 |
6.3 |
|
|
$51,000–60,999 |
17 |
5.7 |
|
|
|
$61,000 or more |
36 |
12.0 |
Instruments
Flourishing Scale (FS). The FS (Spanish version) was
administered, a unidimensional self-report measure of psychosocial well-being
developed by Diener et al. (2010). The FS consists of 8 items rated on a
7-point agreement scale (1 = strongly disagree to 7 = strongly agree). Item
ratings are summed to yield a total score ranging from 8 to 56, with higher
scores indicating greater flourishing. The FS does not have diagnostic cutoffs;
interpretation is continuous, reflecting the level of perceived purpose, competence,
positive relationships, and meaning. Prior work supports excellent internal
consistency and structural validity for the FS across languages, including
Spanish-speaking samples (e.g., De la Fuente et al., 2017; Martín-Carbonell et
al., 2021; Landa-Blanco et al., 2023). In Puerto Rico, validations in community
samples (González-Rivera, 2018) and in the atheist community (González-Rivera,
2019) have documented a unidimensional structure and reliable scores, providing
relevant local precedent.
Generalized Anxiety Disorder–7 (GAD-7). The Spanish
GAD-7 was administered. The GAD-7 is a unidimensional self-report screener of
generalized anxiety symptoms over the past two weeks developed by Spitzer et
al. (2006). It includes seven items scored on a 4-point frequency scale (0 =
not at all, 1 = several days, 2 = more than half the days, 3 = nearly every
day) that are summed to a total score ranging from 0 to 21. Conventional
severity bands are minimal (0–4), mild (5–9), moderate (10–14), and severe (15–21)
(Spitzer et al., 2006). Prior research has shown excellent internal consistency
for the English and Spanish versions, with supportive evidence in Puerto Rican
adult samples (e.g., Pagán-Torres et al., 2020a). In the present study, GAD-7
scores were used as an external criterion to examine the construct validity of
the FS, with the a priori expectation of inverse associations (higher
flourishing, lower anxiety).
Eight-Item Patient Health Questionnaire (PHQ-8). The
Spanish PHQ-8 was used. The PHQ-8 is an eight-item self-report measure of
depressive symptom severity over the past two weeks, derived from the PHQ-9 by
omitting the suicidality item (Kroenke et al., 2009). Items use the same 0–3
frequency options as the GAD-7; scores are summed to yield a total score
ranging from 0 to 24. Recommended severity ranges are minimal (0–4), mild
(5–9), moderate (10–14), moderately severe (15–19), and severe (20–24), and a cutoff
of ≥ 10 is commonly used to indicate probable major depression (Kroenke
et al., 2009). Evidence supports strong psychometrics in Puerto Rico, including
high internal consistency in Puerto Rican LGBT samples (González-Rivera, 2019)
and robust reliability and a clear factor structure in Puerto Rican adults
(Pagán-Torres et al., 2020b). In the present study, PHQ-8 scores
served—alongside GAD-7—as external validators of the FS, with the a priori
expectation of negative correlations (higher flourishing associated with fewer
depressive symptoms).
Procedure and Data Analysis
Recruitment and data collection. The study was
disseminated via a digital advertisement on Meta that briefly described the
project and linked to the online questionnaire (PsychData).
Participation occurred entirely on the web, and the dataset was closed once the
planned sample size was reached.
Data preparation. After download, the dataset was
cleaned by checking by checking for duplicates, inconsistencies, and atypically
short completion times. Item performance was examined (means, dispersion,
item–total correlations) and estimated internal consistency using Cronbach’s
α and McDonald’s ω with 95% confidence intervals, with benchmarks
≥ .70 for adequate reliability (DeVellis, 2017). To evaluate assumptions,
Item-level normality was assessed for FS items using Shapiro–Wilk and Kolmogorov–Smirnov
tests and evaluated multivariate normality using omnibus tests implemented in
Stata (Mardia’s skewness and kurtosis, Henze–Zirkler, and Doornik–Hansen; Doornik & Hansen, 2008).
Measurement modeling. Given the FS’s 7-point response
format and the observed departures from univariate and multivariate normality,
CFA models were estimated using maximum likelihood with Satorra–Bentler
corrections to obtain robust standard errors and fit indices (Satorra & Bentler, 2001). As a sensitivity analysis,
models were re-estimated the FS model using an
estimator appropriate for ordinal indicators (based on polychoric
correlations); conclusions regarding structure and loadings were unchanged. Model
adequacy was judged holistically using χ², CFI, TLI, RMSEA (90% CI), and
SRMR, referencing common benchmarks (e.g., CFI/TLI ≥ .95; RMSEA ≤
.06–.08; SRMR ≤ .08; Byrne, 2010) alongside substantive plausibility.
When theoretically warranted (e.g., semantically overlapping content), targeted
alternative specifications were evaluated, such as allowing correlated
residuals for the most similar item pair(s) (e.g., Items 5–6), to balance
parsimony and model fit. However, the parsimonious model was retained unless
modifications were clearly justified and improved fit without compromising
interpretability.
Measurement invariance. To ensure the FS operates
equivalently across subgroups, multi-group CFA was conducted by gender identity
and sexual orientation. Invariance was evaluated sequentially: configural (same
factorial structure), metric (equal loadings), and scalar (equal
thresholds/intercepts). Decisions at each step combined nested-model
comparisons with changes in approximate fit; specifically, ΔCFI and
ΔTLI ≤ .010 and ΔRMSEA ≤ .015 were taken as evidence that
additional constraints did not meaningfully degrade fit (Chen, 2007). If full
scalar invariance was not attainable, partial invariance was planned to adopt
partial invariance by freeing a limited, theory-justified set of parameters to
enable latent mean comparisons across groups with appropriate caution. In
addition to approximate fit-change criteria (ΔCFI/ΔTLI/ΔRMSEA),
χ² difference tests between nested models were reported for completeness.
When robust (scaled) χ² statistics are used, scaled difference testing is
applied where appropriate. Because χ² difference testing is sensitive to
sample size and minor model deviations, invariance decisions prioritize changes
in approximate fit indices, consistent with common recommendations for
invariance evaluation (Chen, 2007; Cheung & Rensvold, 2002; Satorra & Bentler, 2001).
Validity with external criteria. To support validity
evidence for the FS, associations with depressive symptoms (PHQ-8) and anxiety
symptoms (GAD-7) were examined. Given the ordinal nature of these scales and
potential deviations from normality, Spearman correlations were used, and
effect sizes were interpreted using conventional benchmarks. Consistent with
theory and prior evidence, negative correlations were expected (greater
flourishing, fewer symptoms). In addition, Average Variance Extracted (AVE) was
computed for the one-factor FS model as an indicator-level convergence index
(i.e., the extent to which the latent factor explains variance in its
indicators relative to error; Fornell & Larcker, 1981). Importantly, AVE
provides evidence of convergence at the level of indicators within the
measurement model and does not replace convergent validity evidence based on
associations with independent positive well-being constructs (e.g., life
satisfaction, eudaimonic well-being, social connectedness), as emphasized in
classic treatments of construct validity and convergent/discriminant validation
(Campbell & Fiske, 1959; Cronbach & Meehl, 1955). Accordingly,
convergent validity with an independent positive well-being measure remains a
key goal for future studies.
Ethical Aspects
The study protocol received approval from the
Institutional Review Board (IRB) of Ponce Health Sciences University (PHSU) in
Ponce, Puerto Rico (Protocol #2002029207). Participants completed the
questionnaire after providing electronic informed consent. Participation was
voluntary, and individuals were informed they could withdraw at any time
without penalty. To safeguard confidentiality and anonymity, procedures were
implemented to avoid collecting direct identifiers, and all data were stored on
secure, access-restricted servers. All procedures adhered to the Declaration of
Helsinki and the APA Ethical Principles for research with human participants.
RESULTS
Tests of Normality
Item distributions indicated departures from normality
across the eight FS indicators, with consistently negative skewness
(−1.308 to −2.582) and positive kurtosis (0.819 to 7.078),
suggesting concentration of responses at the upper end of the scale and some
leptokurtosis (see Table 2). More importantly for CFA, multivariate normality
of the eight FS items was rejected by omnibus tests in Stata, including Mardia’s multivariate skewness, χ²(120) = 1,816.744, p
< .001 (mSkewness = 35.895); Mardia’s
kurtosis, χ²(1) = 3,521.863, p < .001 (mKurtosis
= 166.679); Henze–Zirkler, χ²(1) = 23,616.003, p
< .001 (HZ = 23.516); and Doornik–Hansen, χ²(16) = 749.282, p <
.001. In light of the lack of multivariate normality,
subsequent factor-analytic models relied on robust estimation (Satorra–Bentler corrections), and an ordinal estimator
based on polychoric correlations was examined as a
sensitivity analysis; correlational analyses prioritized rank-based (Spearman)
coefficients.
Table 2. Descriptive Statistics,
Normality, Item Quality Indices and Confidence Intervals for Factor Loadings.
|
Item |
M |
SD |
Skew |
Kurt |
KS |
SW |
rbis |
R2 |
ωid |
β |
95% CIsb |
|
1 |
5.78 |
1.638 |
-1.472 |
1.352 |
0.268 |
0.751 |
0.819 |
0.697 |
0.929 |
0.827 |
[.774, .879] |
|
2 |
5.68 |
1.676 |
-1.308 |
0.819 |
0.253 |
0.777 |
0.742 |
0.564 |
0.935 |
0.759 |
[.691, .827] |
|
3 |
5.81 |
1.564 |
-1.561 |
1.906 |
0.247 |
0.754 |
0.825 |
0.712 |
0.928 |
0.844 |
[.795, .892] |
|
4 |
6.11 |
1.45 |
-2.056 |
3.875 |
0.301 |
0.658 |
0.751 |
0.626 |
0.934 |
0.789 |
[.705, .872] |
|
5 |
6.33 |
1.256 |
-2.582 |
7.078 |
0.351 |
0.59 |
0.821 |
0.754 |
0.93 |
0.869 |
[.806, .932] |
|
6 |
6.31 |
1.267 |
-2.466 |
6.514 |
0.36 |
0.603 |
0.869 |
0.802 |
0.927 |
0.91 |
[.875, .945] |
|
7 |
5.8 |
1.608 |
-1.493 |
1.508 |
0.255 |
0.751 |
0.756 |
0.613 |
0.934 |
0.784 |
[.715, .853] |
|
8 |
5.84 |
1.573 |
-1.748 |
2.555 |
0.286 |
0.726 |
0.741 |
0.567 |
0.935 |
0.764 |
[.685, .843] |
Note: M = Mean; SD = Standard
deviation; Skew = Skewness; Kurt = Kurtosis; Standard error of skewness = .141;
Standard error of kurtosis = .281. KS = Kolmogorov-Smirnov; SW = Shapiro-Wilk;
Kolmogorov-Smirnov and Shapiro-Wilk degrees of freedom = 300, all p-values
< .001; rbis = discrimination indices; R2 = explained
variance; ωid = McDonald's Omega if item
deleted; β = standardized regression
coefficient for each item; CIsb
= confidence interval with the Satorra–Bentler
correction for non-normality.
Confirmatory Factor Analysis
Sample size planning for SEM depends on model
complexity, communalities, and estimator choice. Monte Carlo evidence shows
that simple, well-identified CFA models can yield stable solutions in samples
in the low hundreds when factor loadings are strong, whereas multi-group
applications require adequate per-group sizes (Wolf et al., 2013). In addition
to this Monte Carlo–based rationale, adequacy was cross-checked using Arifin’s
web-based sample size calculator for SEM/CFA (Arifin, 2025a,b),
which suggested that the planned sample size met minimum requirements for the
specified CFA model and target fit criteria. Accordingly, the present total
sample (N = 300) was expected to be sufficient for a one-factor CFA and to
support preliminary multi-group invariance tests, while recognizing that
smaller subgroups (e.g., transgender and nonbinary participants) were
underpowered for separate invariance modeling.
The one-factor model of the FS was estimated using
maximum likelihood with Satorra–Bentler robust
correction. The robust fit was adequate: χ²SB(20)
= 55.278, p < .001; CFISB = .964, TLISB = .950, RMSEASB = .077, and SRMR =
.032. Non-robust indices—χ²(20) = 115.981, CFI =
.951, TLI = .932, RMSEA = .126—were more stringent, consistent with the
item-level skewness and leptokurtosis; therefore, interpretation relies on the
robust estimates. All standardized factor loadings were high and statistically
significant (range .76–.91; see Table 2 for 95% CIs), indicating that each item
contributes substantially to a single latent flourishing factor. Error
variances were moderate to low (.17–.42), suggesting acceptable
indicator precision. Taken together, the results support the scale’s unidimensionality in this Puerto Rican LGBT sample: robust
fit indices fall within recommended thresholds (CFI/TLI >= .95; RMSEA <= .08; SRMR < .08), and loadings are consistently strong. Accordingly,
use of a single total flourishing score is justified for subsequent analyses.
Figure 1 depicts the final estimated model.
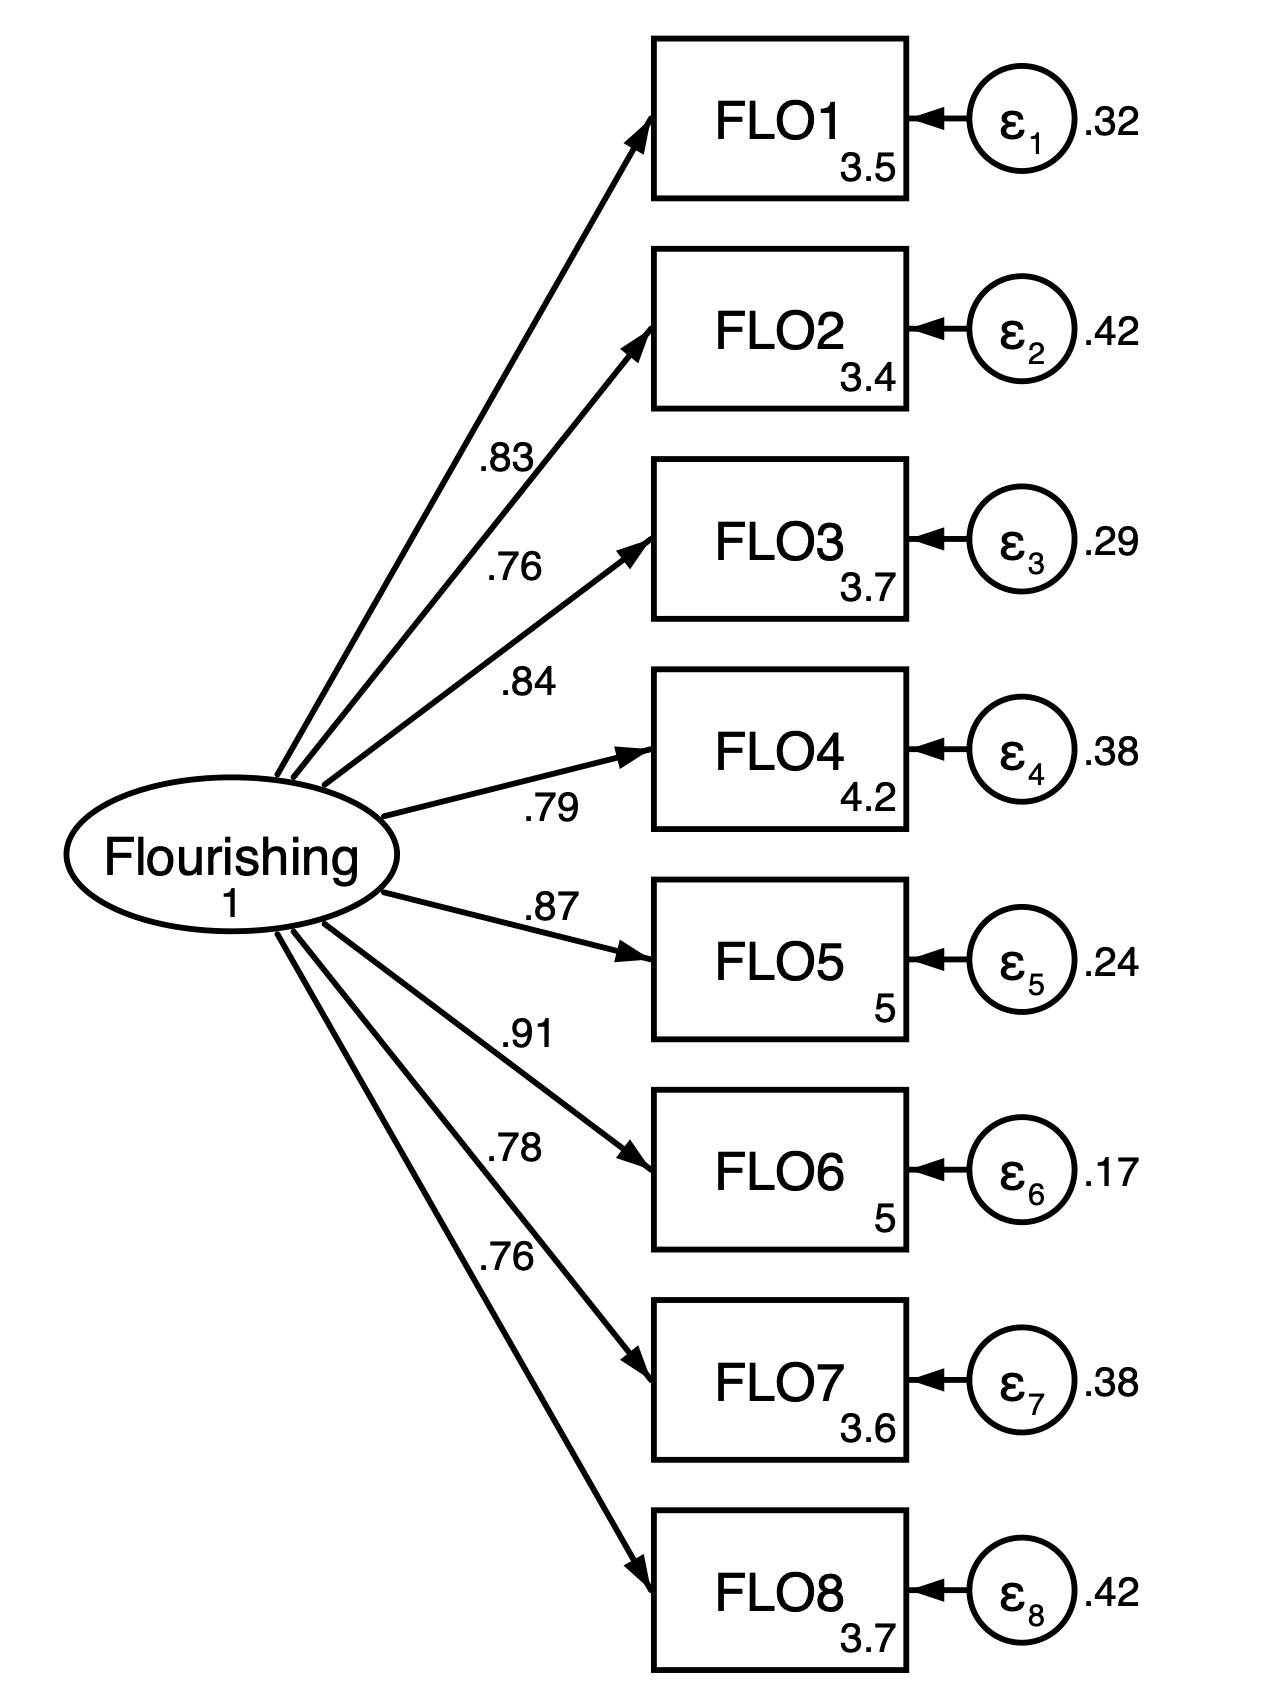
Figure 1. CFA of the Flourishing Scale.
Construct Validity, Internal Consistency, and Correlations
The FS showed excellent internal consistency, with
both Cronbach’s α and McDonald’s ω in the desirable range, comparable
to the strong reliability observed for the PHQ-8 and GAD-7. For the FS,
composite reliability was high and the AVE exceeded the .50 benchmark,
indicating that, on average, the latent factor explains more variance in its
indicators than error—evidence of indicator-level convergence within the
measurement model (Fornell & Larcker, 1981).
As expected, the FS correlated negatively with
depressive (PHQ-8) and anxiety (GAD-7) symptoms, consistent with the
theoretical view that flourishing reflects positive mental health rather than
the absence of distress. Specifically, flourishing correlated inversely with
depressive symptoms (PHQ-8; Spearman ρ = −.598) and anxiety symptoms
(GAD-7; Spearman ρ = −.497), both p < .01 (Table 3). The
association between PHQ-8 and GAD-7 was strong and positive, reflecting their
shared symptom burden. To provide robust inference under ordinal, non-normal
responses, Spearman correlations are reported below the diagonal, while Pearson
correlations appear above the diagonal; all coefficients were significant at p
< .01 (two-tailed) (see Table 3). Together with the CFA results, this
pattern supports the construct and criterion-related validity of the FS in this
Puerto Rican LGBT sample.
Table 3. Construct Validity, Internal
Consistency, and Correlations.
|
Scale |
M |
SD |
α |
ω |
CR |
AVE |
1 |
2 |
3 |
|
1. FS |
47.66 |
10.125 |
0.939 |
0.94 |
0.92 |
0.61 |
- |
-0.559 |
-0.435 |
|
2. PHQ-8 |
8.5 |
6.424 |
0.909 |
0.91 |
- |
- |
-0.598 |
- |
0.787 |
|
3. GAD-7 |
7.85 |
6.111 |
0.935 |
0.935 |
- |
- |
-0.497 |
0.792 |
- |
Note. M = mean; SD = standard
deviation; α = Cronbach’s alpha; ω = McDonald’s
omega; CR = Composite Reliability; AVE = Average Variance Extracted. Above the
main diagonal are Pearson product–moment correlations (r); below the
diagonal are Spearman rank-order correlations (ρ). All correlations were statistically significant at p
< .01 (two-tailed).
Measurement Invariance
As planned, measurement invariance of the FS across
the two largest gender-identity groups (masculine and feminine) was tested hierarchically (configural → metric →
scalar), with an additional residual model reported for completeness. As
summarized in Table 4, the configural model showed weak absolute fit (RMSEA =
.105; TLI = .896), although CFI was acceptable (CFI = .926), and it served as
the baseline for evaluating fit changes. When factor loadings (metric) and then
intercepts/thresholds (scalar) were constrained, changes in approximate fit
remained within the prespecified criteria (ΔCFI/ΔTLI ≤ .010;
ΔRMSEA ≤ .015), and TLI/RMSEA improved across steps. The residual
model showed a similarly stable pattern (lower RMSEA and virtually unchanged
CFI/TLI relative to the scalar model). Taken together, fit-change patterns were
broadly consistent with approximate metric and scalar invariance by gender
identity; however, given the weak absolute fit of the baseline configural
model, invariance-related conclusions and any subgroup comparisons should be
interpreted cautiously and viewed as preliminary (see Table 4).
Table 4. Measurement Invariance of the
Flourishing Scale by Gender and Sexual Orientation (N = 300)
|
Model |
χ2 |
df |
RMSEA |
CFI |
TLI |
Ref. Model |
Δχ2 |
ΔRMSEA |
ΔCFI |
ΔTLI |
|
By gender (masculine and
feminine) |
||||||||||
|
1. Configural |
182.38 |
40 |
0.105 |
0.93 |
0.9 |
----- |
----- |
----- |
----- |
----- |
|
2. Metric |
203.51 |
47 |
0.099 |
0.92 |
0.9 |
1 |
21.13 |
−.006 |
−.008 |
0.01 |
|
3. Scalar |
212.06 |
55 |
0.088 |
0.92 |
0.92 |
2 |
8.551 |
−.011 |
0 |
0.01 |
|
4. Residual |
218.9 |
64 |
0.08 |
0.92 |
0.93 |
3 |
6.83 |
−.008 |
0 |
0.01 |
|
By sexual orientation (gay,
lesbian, and bisexual) |
||||||||||
|
1. Configural |
260.55 |
60 |
0.112 |
0.89 |
0.85 |
----- |
----- |
----- |
----- |
----- |
|
2. Metric |
297.53 |
74 |
0.106 |
0.88 |
0.86 |
1 |
36.99 |
−.006 |
−.013 |
0.02 |
|
3. Scalar |
316.01 |
90 |
0.097 |
0.88 |
0.88 |
2 |
18.48 |
−.009 |
−.001 |
0.02 |
|
4. Residual |
355.52 |
108 |
0.093 |
0.86 |
0.89 |
3 |
39.51 |
−.004 |
−.012 |
0.01 |
Note. χ² = chi-square; df = degrees of freedom; RMSEA = Root Mean Square Error of
Approximation; CFI = Comparative Fit Index; TLI = Tucker–Lewis Index. “Ref.
Model” indicates the reference model for the reported changes (Δ) in each row.
Invariance criteria: ΔCFI and ΔTLI ≤ .010
and ΔRMSEA ≤ .015. Sequence:
(1) configural = same factorial structure; (2) metric = equal loadings; (3)
scalar = equal intercepts/thresholds; (4) residual = equal unique variances
(exploratory; not required for comparing means). Indices are from multigroup
CFA, and Δ values are computed relative
to the immediately preceding model.
Due to limited subgroup sizes, sexual-orientation
invariance analyses were restricted to gay, lesbian, and bisexual participants;
pansexual and “other” categories were retained in descriptive reporting but not
modeled in multi-group CFA. As shown in Table 4, the configural model again
demonstrated weak absolute fit (RMSEA = .112; CFI = .890; TLI = .846). Under
metric constraints (equal loadings), ΔCFI slightly exceeded the
prespecified .010 criterion (ΔCFI = −.013), despite improvements in
TLI and RMSEA; therefore, evidence for metric invariance across
sexual-orientation groups is mixed/borderline under the stated decision rules.
Moving to the scalar model (equal loadings and intercepts/thresholds),
fit-change indices relative to the metric model met the prespecified criteria
(ΔCFI = −.001; ΔRMSEA = −.009), with further improvement
in TLI and RMSEA. However, because baseline fit was limited and metric
invariance was not clearly supported, scalar invariance and latent mean
comparisons across sexual-orientation groups should be treated as tentative and
warrant replication in larger, more balanced subgroup samples (Table 4). The
residual (strict) model produced an additional decrease in CFI beyond the
criterion (ΔCFI = −.012) alongside improvements in TLI and RMSEA;
this step is reported for completeness and is not required for comparing latent
means or relations.
DISCUSSION
This study provides robust evidence that the FS
exhibits a unidimensional structure, high internal consistency, and
theoretically expected relations with indicators of emotional distress in an
LGBT sample from Puerto Rico. Taken together, the CFA results, strong factor
loadings, and the consistent pattern of inverse correlations with depression
(PHQ-8) and anxiety (GAD-7) support validity evidence based on internal
structure and relations to external criteria, as well as the instrument’s
usefulness as a parsimonious indicator of positive psychological well-being.
Measurement-invariance analyses further examined whether the FS operates
similarly across key subgroups. Although fit-change patterns across
increasingly constrained models were broadly consistent with approximate
invariance at the metric and scalar levels, the weak absolute fit of the
multigroup configural models limits the strength of invariance inferences;
therefore, any subgroup comparisons should be interpreted cautiously and
regarded as preliminary.
Interpretively, the results align with the primary aim
of evaluating the FS’s psychometric validity in a sexually and gender-diverse
Caribbean population. The observed unidimensionality
suggests that eudaimonic components of flourishing—purpose, positive
relationships, competence, and growth—converge on a general well-being factor,
consistent with the scale’s original formulation (Diener et al., 2010). The
direction and magnitude of the associations with PHQ-8 and GAD-7 support the
view of mental health as a continuum in which the presence of well-being is not
merely the absence of symptoms, yet bears a substantive relation to them
(Kroenke et al., 2009; Spitzer et al., 2006; González-Rivera, 2019;
Pagán-Torres et al., 2020). In this way, the FS occupies a coherent position
within the nomological network of well-being, distinguishing itself from
psychopathology while complementing its assessment.
Relative to prior literature, the evidence converges
with validations conducted in Spanish-speaking populations and other cultural
contexts, where a single factor and adequate reliability and validity
indicators have been documented (De la Fuente et al., 2017; Didino
et al., 2019; Martín-Carbonell et al., 2021; Landa-Blanco et al., 2023). These
findings extend the geographical and population reach of the FS by contributing
data from a historically understudied group in Puerto Rico. Demonstrating
invariance by gender identity and examining invariance by sexual orientation
are particularly salient, as these questions are underexplored in the region
and are central for meaningful subgroup comparisons in research and service
evaluation (Martín-Carbonell et al., 2021; Mansouri, 2025; Sabah et al., 2025).
However, in the present data the absolute fit of the multigroup configural
models was weak, and metric evidence across sexual-orientation groups was
borderline. Accordingly, invariance-related conclusions and any latent-mean
comparisons should be treated as tentative and interpreted with appropriate
caution, warranting replication with improved baseline multigroup models,
alternative categorical estimators when appropriate, and larger, more balanced
subgroup samples.
Theoretical implications are clear. First, replicating
a unidimensional model strengthens the conceptualization of flourishing as a
global construct, consistent with positive-psychology proposals that integrate
eudaimonic facets under a common factor (Diener et al., 2010). Second,
invariance testing provides preliminary evidence that key parameters may be
reasonably stable across the largest gender-identity groups and, at the scalar
level, across the modeled sexual-orientation groups; however, weak absolute fit
of the multigroup configural models constrains the strength of these inferences
and underscores the need for replication before making strong claims about
equivalence across groups (De la Fuente et al., 2017; Martín-Carbonell et al.,
2021; Mansouri, 2025; Sabah et al., 2025). Third, the associations with
depression and anxiety support dual-factor models of mental health that
distinguish—but connect—well-being and psychopathology, inviting integrative
models of clinical outcomes (Kroenke et al., 2009; Spitzer et al., 2006).
Practically, the FS emerges as a brief, sensitive tool
for routine well-being assessment in affirmative services and public-health
settings in Puerto Rico. Establishing the FS’s structure and evaluating
measurement invariance in Puerto Rico’s LGBT population can strengthen its
utility for applied settings and can inform subgroup comparisons when such
comparisons are warranted. Its brevity and psychometric soundness make it
suitable for monitoring well-being resources in clinical and community programs
and for evaluating affirmative interventions beyond symptom reduction,
including pre/post-intervention change. In practice, the FS can complement
distress-focused screening (e.g., PHQ-8/GAD-7) by capturing psychosocial assets
relevant to resilience-oriented planning and by informing equity-oriented
targeting of resources across gender-identity groups and sexual-orientation
subgroups (González-Rivera, 2019; Pagán-Torres et al., 2020; Landa-Blanco et
al., 2023).
Importantly, invariance-related conclusions should be
interpreted cautiously given the weak absolute fit of the multigroup configural
models. Although fit-change patterns across increasingly constrained models
were broadly consistent with invariance expectations, limited baseline fit
constrains the strength of inferences about equivalence across groups.
Accordingly, subgroup comparisons (e.g., latent-mean comparisons by gender
group and, where scalar invariance is supported, across sexual-orientation subgroups)
should be viewed as preliminary and should be replicated with improved baseline
multigroup models, alternative categorical estimators when appropriate, and
larger subgroup samples—particularly for smaller gender-diverse categories.
From an equity perspective, robust evidence on the FS
in Puerto Rico’s LGBT/SGM community has direct implications for service
planning and the evaluation of affirmative programs (e.g., peer support,
inclusive school environments, and clinically competent LGBTQ+ care). A brief,
locally validated flourishing measure can support routine monitoring of
psychosocial well-being resources in clinical, educational, workplace, and
community settings, complementing deficit-focused indicators and informing
asset-focused intervention targets. Local validation also enables the use of
comparable indicators that facilitate alignment with regional and global
research networks on LGBT/SGM health, contributing evidence from the
Spanish-speaking Caribbean to a literature still dominated by studies from
high-income countries.
Several strengths merit note: (a) a rigorous
instrumental approach with CFA and robust fit criteria under non-normality; (b)
explicit incorporation of invariance by gender and sexual orientation—an
underexplored issue in the region; (c) triangulation of construct validity with
clinically relevant indicators (PHQ-8, GAD-7); and (d) a contribution to the
limited local evidence on well-being among Puerto Rico’s LGBT population,
extending prior FS validations on the Island (González-Rivera, 2018, 2019).
Several limitations should be noted. First, the sample
was recruited online via Meta and was not stratified; thus, generalizability to
all LGBT adults in Puerto Rico may be limited and some subgroups may be
underrepresented. Second, the sample composition reflects an overrepresentation
of the largest subgroup (cisgender gay men), whereas transgender and nonbinary
participants comprised small cell sizes (e.g., nonbinary n = 11; transgender n
= 7; other gender identity n = 4; see Table 1), precluding invariance testing
for these identities and limiting conclusions about FS functioning for TNB
populations. Accordingly, claims regarding TNB-specific validity should be
considered preliminary. Third, validity evidence relied primarily on
associations with distress (PHQ-8, GAD-7) and on indicator-level convergence
(AVE); convergent validity with independent positive well-being measures (e.g.,
life satisfaction, eudaimonic well-being, social connectedness) was not
assessed and remains an important next step. Fourth, although robust estimation
addressed non-normality, replication using categorical estimators (e.g., WLSMV)
and larger, more diverse subgroup samples is warranted to confirm parameter
stability and invariance conclusions.
Future research should: (1) use longitudinal designs
to establish test–retest stability and sensitivity to change; (2) incorporate
positive well-being measures (e.g., life satisfaction, positive affect) to
strengthen the nomological network; (3) conduct finer-grained invariance
analyses by trans and nonbinary identities—when sample sizes allow—and by
intersectional markers (age, socioeconomic status); (4) run implementation
trials in clinical and community services to evaluate the FS as an outcome and
quality indicator; and (5) compare estimation methods (robust ML vs. WLSMV) to
refine methodological recommendations for ordinal responses.
In sum, this study supports the FS as a brief,
reliable, and valid measure of flourishing in Puerto Rico’s LGBT population,
providing evidence for a unidimensional structure, strong internal consistency,
and theoretically expected relations with depression and anxiety. Invariance
testing yielded fit-change patterns broadly consistent with approximate
invariance across the two largest gender-identity groups and, more tentatively,
across modeled sexual-orientation groups; however, weak absolute fit of the multigroup
configural models limits the strength of invariance conclusions. These findings
extend prior validations in Hispanic contexts and position the FS as a
practical resource for research, clinical practice, and public health aimed at
promoting well-being on the Island, while highlighting the importance of
replication with improved baseline multigroup models and larger subgroup
samples for stronger subgroup-comparison inferences.
ORCID
Juan Aníbal González-Rivera: https://orcid.org/0000-0003-0622-8308
AUTHORS’ CONTRIBUTION
Juan Aníbal
González-Rivera: Conceptualization, Methodology, Investigation, Writing –
Original Draft, Review & Editing, Formal Analysis, Project Administration.
FUNDING
SOURCE
This study was not funded by
any entity or sponsor.
CONFLICT
OF INTEREST
The author expresses no conflicts of
interest.
ACKNOWLEDGMENTS
Not applicable.
REVIEW
PROCESS
This study has been reviewed by Andrei Franco-Jimenez and another external
reviewer in double-blind mode. The editor in charge was David Villarreal-Zegarra.
The review process is included as supplementary material 1.
DATA AVAILABILITY
STATEMENT
Researchers and
academics interested in accessing the research data may contact the
corresponding author via email.
DECLARATION OF THE USE OF GENERATIVE ARTIFICIAL INTELLIGENCE
The author used DeepL to translate specific
sections of the manuscript and Grammarly to improve the wording of certain
sections.
DISCLAIMER
The authors are responsible for all statements made in this article.
REFERENCES
Arifin, W. N. (2025a). Sample size
calculator (web). Retrieved from http://wnarifin.github.io
Arifin, W. N. (2025b). A web-based sample size calculator for structural
equation modelling. Education in Medicine Journal, 17(1), 195–212.
https://doi.org/10.21315/eimj2025.17.1.14
Ato, M., López, J. J., & Benavente, A. (2013). Un sistema de clasificación de Ios diseños de investigación en
psicología [A classification system for research designs in psychology]. Anales
de Psicología, 29(3), 1038–1059. https://doi.org/10.6018/analesps.29.3.178511
Byrne, B. M. (2010). Structural
equation modeling with AMOS: Basic concepts, applications, and programming.
Psychology Press.
Campbell, D. T., & Fiske, D. W. (1959). Convergent and discriminant
validation by the multitrait-multimethod matrix.
Psychological Bulletin, 56(2), 81–105. https://doi.org/10.1037/h0046016
Chen, F. F. (2007). Sensitivity of goodness of fit indexes to lack of
measurement invariance. Structural Equation Modeling, 14, 464-504.
https://doi.org/10.1080/10705510701301834
Cheung, G. W., & Rensvold, R. B. (2002). Evaluating goodness-of-fit
indexes for testing measurement invariance. Structural Equation Modeling: A
Multidisciplinary Journal, 9(2), 233–255.
https://doi.org/10.1207/S15328007SEM0902_5
Cronbach, L. J., & Meehl, P. E. (1955). Construct validity in
psychological tests. Psychological Bulletin, 52(4), 281–302.
https://doi.org/10.1037/h0040957
De la Fuente, R., Parra, A., & Sánchez-Queija, I. (2017). Psychometric Properties of the Flourishing Scale and Measurement
Invariance Between Two Samples of Spanish University Students. Evaluation &
the Health Professions, 40(4), 409–424.
https://doi.org/10.1177/0163278717703446
DeVellis, R. F. (2017). Scale development: Theory and applications (4th
Ed). Sage Publications.
Didino, D., Taran, E., Barysheva, G., &
Casati, F. (2019). Psychometric evaluation of the Russian version of the
flourishing scale in a sample of older adults living in Siberia. Health and
Quality of Life Outcomes, 17, 37. https://doi.org/10.1186/s12955-019-1100-6
Diener, E., Wirtz, D., Tov, W., Kim-Prieto, C., Choi, D.-W., Oishi, S.,
& Biswas-Diener, R. (2010). New well-being measures: Short scales to assess
flourishing and positive and negative feelings. Social Indicators Research,
97(2), 143–156. https://doi.org/10.1007/s11205-009-9493-y
Doornik, J. A., & Hansen, H. (2008). An omnibus test for univariate
and multivariate normality. Oxford Bulletin of Economics and Statistics, 70(1),
927–939. https://doi.org/10.1111/j.1468-0084.2008.00537.x
Espejo, B., Martín-Carbonell, M., & Checa, I. (2022). Psychometric properties and measurement invariance by gender of the
abbreviated three-item version of the Satisfaction with Life Scale in a
Colombian sample. International Journal of Environmental Research and Public
Health, 19(5), 2595. https://doi.org/10.3390/ijerph19052595
Expósito-Campos, P., Pérez, J. I., & Salaberria, K. (2022). Empirically supported affirmative psychological interventions for
transgender and non-binary youth and adults: A systematic review. Clinical
Psychology Review, 95, 102229. https://doi.org/10.1016/j.cpr.2022.102229
Fornell, C., & Larcker, D. F. (1981). Evaluating structural equation
models with unobservable variables and measurement error. Journal of Marketing
Research, 18(1), 39–50. https://doi.org/10.1177/002224378101800104
González-Rivera, J. A. (2018). Propiedades
psicométricas de la Escala de Florecimiento en Puerto Rico [Psychometric
Properties of the Flourishing Scale in Puerto Rico]. Revista Evaluar, 18(3),
30-43. https://doi.org/10.35670/1667-4545.v18.n3.22203
González-Rivera, J. A. (2019). Flourishing Scale
in the atheist community of Puerto Rico: Validation and psychometric study. Ciencias de la Conducta, 34(1), 215–230.
http://cienciasdelaconducta.org/index.php/cdc/article/view/19
González-Rivera, J. A. (2019). Validation and dimensionality of Patient
Health Questionnaire for Depression (PHQ-8 and PHQ-9) in Hispanic LGBT
Community. International Journal of Recent Scientific Research, 10(12),
36670-36676.
Hatzenbuehler, M. L. (2016). Structural stigma and health inequalities:
Research evidence and implications for psychological science. American
Psychologist, 71(8), 742–751. https://doi.org/10.1037/amp0000068
Hatzenbuehler, M. L., Phelan, J. C., & Link, B. G. (2013). Stigma as
a fundamental cause of population health inequalities. American Journal of
Public Health, 103(5), 813–821. https://doi.org/10.2105/AJPH.2012.301069
Heine, S. J., Lehman, D. R., Peng, K., & Greenholtz, J. (2002).
What’s wrong with cross-cultural comparisons of subjective Likert scales? The
reference-group effect. Journal of Personality and Social Psychology, 82(6),
903–918. https://doi.org/10.1037/0022-3514.82.6.903
Kittiteerasack, P., Matthews, A., & Park, C. (2021). Psychometric
properties of the Thai version of the Internalized Sexual Stigma scale for
research on lesbian, gay, bisexual, and transgender (LGBT) populations. Journal
of Homosexuality, 68(13), 2348–2367.
https://doi.org/10.1080/19419899.2021.2000013
Kroenke, K., Strine, T. W., Spitzer, R. L.,
Williams, J. B. W., Berry, J. T., & Mokdad, A. H. (2009). The PHQ-8 as a
measure of current depression in the general population. Journal of Affective
Disorders, 114(1–3), 163–173. https://doi.org/10.1016/j.jad.2008.06.026
Landa-Blanco, M., Cortés-Ramos, A., Vásquez, G., Reyes, Y., &
Echenique, Y. (2023). Psychometric properties of the Spanish version of the
Flourishing Scale in the Honduran population. Frontiers in Psychology, 14,
1223269. https://doi.org/10.3389/fpsyg.2023.1223269
Mansouri, M. (2025). Psychometric validation and measurement invariance
of the Flourishing Scale (FS) in the Algerian context. Measurement Instruments
for the Social Sciences, 7, e15497. https://doi.org/10.5964/miss.15497
Martín-Carbonell, M., Espejo, B., Checa, I., & Fernández-Daza, M.
(2021). Adaptation and measurement invariance by
gender of the Flourishing Scale in a Colombian sample. International Journal of
Environmental Research and Public Health, 18(5), 2664.
https://doi.org/10.3390/ijerph18052664
Meredith, W. (1993). Measurement invariance, factor analysis and
factorial invariance. Psychometrika, 58(4), 525–543.
https://doi.org/10.1007/BF02294825
Meyer, I. H. (2003). Prejudice, social stress, and mental health in
lesbian, gay, and bisexual populations: Conceptual issues and research
evidence. Psychological Bulletin, 129(5), 674–697.
https://doi.org/10.1037/0033-2909.129.5.674
Pagán-Torres, O. M., González-Rivera, J. A., & Rosario-Hernández, E.
(2020b). Psychometric Analysis and Factor Structure of
the Spanish Version of the Eight-Item Patient Health Questionnaire in a General
Sample of Puerto Rican Adults. Hispanic Journal of Behavioral Sciences, 42(3),
401-415. https://doi.org/10.1177/0739986320926524
Pagán-Torres, O., González-Rivera, J. A., & Rosario-Hernández, E.
(2020a). Reviewing the psychometric properties and factor structure of the
Generalized Anxiety Disorder-7 (GAD-7) in a sample of Puerto Rican adults.
International Journal of Recent Scientific Research, 11(1), 36885-36888.
Pozo-Muñoz, C., Garzón-Umerenkova, A., Bretones-Nieto, B., & Ligia-Charry, C. (2016).
Psychometric properties and dimensionality of the “Flourishing Scale” in
Spanish-speaking population. Electronic Journal of Research in Educational
Psychology, 14(1), 175-192. http://dx.doi.org/10.14204/ejrep.38.15044
Putnick, D. L., & Bornstein, M. H. (2016). Measurement invariance
conventions and reporting: The state of the art and future directions for
psychological research. Developmental Review, 41, 71–90.
https://doi.org/10.1016/j.dr.2016.06.004
Sabah, A., Aljaberi, M., El-Mir, M., Hajji,
J., & Alduais, A. (2025). Psychometric properties
of the Arabic Flourishing Scale. Qualitative Health Research, 35(2), 321–336.
https://doi.org/10.1177/10497315251315942
Satorra, A., & Bentler, P. M. (2001). A scaled difference chi-square test
statistic for moment structure analysis. Psychometrika, 66(4), 507-514.
https://doi.org/10.1007/BF02296192
Spitzer, R. L., Kroenke, K., Williams, J. B. W., & Löwe, B. (2006).
A brief measure for assessing generalized anxiety disorder: The GAD-7. Archives
of Internal Medicine, 166(10), 1092–1097.
https://doi.org/10.1001/archinte.166.10.1092
Vandenberg, R. J., & Lance, C. E. (2000). A review and synthesis of
the measurement invariance literature: Suggestions, practices, and
recommendations for organizational research. Organizational Research Methods,
3(1), 4–70. https://doi.org/10.1177/109442810031002
Wolf, E. J., Harrington, K. M., Clark, S. L., & Miller, M. W.
(2013). Sample size requirements for structural equation models: An evaluation
of power, bias, and solution propriety. Educational and Psychological
Measurement, 73(6), 913–934. https://doi.org/10.1177/0013164413495237